


Are Fintechs opening 44% of new checking accounts?
Of course not

Key insights in this post
A recent Forbes article highlighted a survey claiming that Digital Banks opened 44% of new checking accounts in 2024
The survey has conceptual issues and its results do not align with publicly available data on checking account origination and volumes
Conceptual issues
The survey redefines the meaning of “checking account” to include any kind of account from which consumers make payments, including stored value and P2P. They specifically mention Chime, Square (Cash App), and PayPal
None of the named products are actually checking accounts in any legal sense and some are not used that way
The defined products also excludes key account types that consumers actually do spend from:
Credit Cards, which are the primary spending vehicle for credit worthy consumers — and are concentrated within a handful of incumbent issuers
Zelle, which is larger than Cash App and Venmo combined but is not an independent service. Zelle use is also restricted to incumbent banks
General Purpose Reloadable (GPR) prepaid cards which were the prior insurgent product for the unbanked and underbanked, but have been displaced by Neobanks — A big part of Neobank growth has cannibalized GPR cards, not banks
Data issues
Direct Deposit: The new digital spending accounts do have material direct deposit volume that usually signifies a primary checking account
Balances: The digital spending accounts do not hold much deposit balances as measured in the call reports of the big BIN-sponsors
Bill Pay: The digital spending accounts do not account for much bill pay activity as measured by Direct Debit volume at their BIN-sponsors
Debit spend: The digital spending accounts do not account for much Debit Card volume as measured in industry league tables
The Forbes article did not discuss methodology, sample size, questions asked or other key inputs that could help us evaluate the results
The study also found that larger banks are outgrowing smaller banks, a finding I also documented in prior posts
Introduction
I used to do a lot of work in check processing. I worked in big check processing shops that were seeing year-over-year volume declines far in excess of the industry “bible” that showed only a modest decline.
Finally, I did some research on how the “bible” calculated check declines. It was hard to find the original source, but eventually I did. Essentially, a static model was fed the latest macro indicators each year. The model had been calibrated early in its life but not after the first few years. Over time, the correlation of those macro indicators to check volumes had shifted, but no one adjusted the model. The gap between actual checks volumes and estimated check volumes just got wider every year.
Everyone suspected the source was wrong, but we used it anyway because nothing else was available. We liked to say we “held our noses” and quoted it anyway.
I see similar examples of well-intentioned, but obviously incorrect payments research all the time. Thinking critically about that research reveals the issues, but no one bothers to do so. That’s what I’m here for!
This post will assess a recent claim on consumer payment behaviors that is obviously wrong but, has been widely quoted anyway. Accepting this research at face value could cause a lot of smart people to make very bad investment decisions.
The study
“A new study from Cornerstone Advisors, looking at the financial services providers that Americans opened checking accounts with in 2024, underscores the continued dominance of digital banks and fintechs like Chime, PayPal, and Square in the checking account market.
Digital banks and fintechs dominate new checking accounts opened...Digital banks and fintechs captured nearly half (44%) of all new checking accounts opened in 2024. Combined, megabanks (Bank of America, Chase, Citi, and Wells Fargo) and regional banks (those with $100 billion to $1 trillion in assets) accounted for 43% of all accounts opened.”
- Forbes, January 6, 2025
As a warning, I can’t find the original study – the version I did find had no details on methodology. There is no indication of sample size or sample selection and we don’t know what questions were asked. In other words, we just have to take their word for it.
I will assess the study in two parts: the conceptual issues and the calibration to public data sources.
Conceptual issues
The survey claims to measure checking accounts but doesn’t. Instead, they are measuring “spending accounts” – any service you can make a payment from. So, they redefined the meaning of checking account to get the 44% result, but keep calling them checking accounts anyway.
My biggest issue with their definition of “spending accounts” is that they exclude some of the biggest ones:
General Purpose Reloadable (GPR) prepaid cards. These are likely excluded to see how much traction “digital banks and Fintechs” are getting. However, before the Neobanks, GPR cards were a key way that low-balance consumers managed their spending. Neobanks have replaced them. We will see in the data section that Neobanks seem to be cannibalizing GPR cards rather than bank checking accounts
Credit Cards. These are likely excluded because they are backed by a credit line (“pay later”) rather than a store of value (“pay now”). But credit cards are the spending vehicle of choice for a large part of the population – including me. The industry even calls card purchase volume: “spend”. By excluding credit cards, the survey is missing millions of new spending accounts, most of which are at a handful of incumbent banks
Zelle. This one is trickier. The article calls out Cash App and Venmo as spending accounts. These two likely account for the bulk of account openings surveyed. But if a consumer starts using Zelle, it isn’t counted – even though it does the same P2P transactions. Zelle is just a feature of a checking account, but it is far outgrowing Cash App and Venmo. Therefore, the survey is over-crediting Fintechs and under-crediting incumbents
If all these conceptual issues were adjusted for, the headline findings would be far less headline-worthy.
A final point is that it looks to me like the survey population skews young. This is common in consumer research because only younger, lower income consumers will take the time to fill out a survey when the participation fee is modest. We don’t know if they weighted the survey population to capture older generations and higher incomes, but if not, then of course more of the new accounts would be going to free, digital providers.
Real world data
The Forbes article is dismissive of the idea that a Cash App account or a PayPal account is fundamentally different from a checking account, but this ignores the notion of “primacy”. In banking: a “primary” checking account gets direct deposit of payroll. Other attributes include paying bills, and holding liquidity:
Direct Deposit: As we shall see, very few consumers use nonbank spending accounts for direct deposit – which is the main way banks determine if a checking account is primary
Balances: the collective balances in these spending accounts are modest. That is partially because they target a low-balance segment and partially because they are really auxiliary accounts, in addition to a bank checking account not instead of
Bill Pay. Since these accounts don’t have checks, users must pay bills with Debit Cards or Direct Debits (ACH). Yet they don’t have much Direct Debit volume or Debit Card volume
Debit card usage for purchases: Usage is light relative to active debit users at banks. And the BIN sponsors behind these accounts collectively have modest spend statistics. Note that more credit worthy consumers use Credit Cards for purchasing, not debit cards. So the absence of debit volume could simply signal that the customer base skews affluent
So, these nonbank spending accounts are not functional equivalents of Checking Accounts, but more like auxiliary accounts for narrow use cases. Even if more of them are opened than bank checking accounts, the consumer is not shifting their primacy to the nonbank, just shifting some specific transactions.
The survey also measures new accounts rather than the stock of accounts. But we know that relatively few people open new checking accounts each year — The average checking is 17 years old. So, even if you agree that some of these spending accounts are substitutes, how many incumbent accounts are really at risk?
Thankfully we have real data to address all these questions.
Direct Deposit: The incumbents are adding far more volume than the insurgents
The survey specifically mention Chime, PayPal & Square as examples of “digital banks” that offer “spending accounts”.
PayPal. PayPal wallets are stored value accounts used mostly for eCommerce purchases. In order to even use PayPal the consumer needs an actual checking account or credit card to fund the stored value. As we saw in my post on PayPal Engagement, consumers use their wallet 1-2 times per month on average. A typical debit card might be used 30-40 times per month in contrast
Square. The Square reference must be for Cash App, which is indeed used as a substitute bank account by lower income consumers. But most people don’t use Cash App as their primary. Block’s 2024 annual report claims only 2.5M Cash App users take direct deposit. That metric grew by 0.5M over the last two years. And Square actually benefits from not being the primary — a major revenue source is “Instant Transfer” fees to move money back to a primary checking account
Neobanks like Chime indeed have lots of accounts. Chime’s CEO recently disclosed (in a Forbes interview) that it has around 7M accounts, but it is not clear how many take direct deposit. The eventual Chime S-1 will clarify this
According to a recent Payroll.org Direct Deposit survey for NACHA, only 1.7% of 37K respondents reported using online payment systems like PayPal and Cash App as the destination for their direct deposits. This is not exactly “continued dominance” of digital banks.
We have hard data to test whether “digital banks” are in fact capturing 44% of new Primary accounts: Direct Deposit data is publicly available. Every year, NACHA publishes a list of the Top 50 ACH Originators & Receivers. Direct Deposit accounts for the bulk of ACH Receive Credits. If “digital banks” are indeed dominant in new checking accounts/spending accounts, they should also be capturing most of the increase in ACH Receive Credits.
If we compare any two years of NACHA direct deposit data, we can see who is growing and who is not. While this data is not perfect, it is the best we have. A few confounding factors need to be adjusted for:
Fintechs like PayPal, Square & Chime cannot connect directly to the ACH system — they need to go through a “BIN Sponsor”. Fortunately, Fintechs usually disclose who those sponsors are.
Chime uses is Bancorp Bank and Stride Bank
Cash App uses Sutton Bank
PayPal & Venmo use Bancorp – at least for their debit cards
These BIN-sponsors are all listed in NACHA’s table. I also included Pathward and GreenDot. Other Neobanks use smaller sponsors which don’t make the NACHA table, because they are really small
While Direct Deposit is the biggest category of ACH Receive Credits, the second biggest is Zelle settlements. The digital insurgents can’t be Zelle members and don’t have this volume. I reduce the Zelle member data by the average Zelle usage to account for this
The biggest banks bypass NACHA for on-us volume. For example, JPM might represent a payroll company as the Originator and a Chase checking customer as the Receiver. Given how concentrated origination volume is, over 60% of this on-us volume is likely in the big 3 (JPM, BAC, WFC). We need to add it back into their volumes
After all the adjustments, the big 3 alone outgrew the insurgents by 9 to 1 on an absolute basis. Even the incumbent online banks (USAA, NAVY, Ally, Schwab) matched the absolute growth of the digital insurgents. The other big winners are incumbent banks with robust digital banks, e.g., Capital One, Citi.
The big “aha” here is that Pathward & GreenDot shrank and Bancorp grew modestly – between them, they sponsor most of the big GPR programs. What may be happening is that low-balance spending accounts are migrating from incumbent GPR cards to insurgent Neobank accounts, i.e., from one nonbank model to another; this is likely because GPR cards carry a monthly fee while Neobanks are free. The survey results ignore GPR cards even though they were the insurgents of their day and are as much of a “spending account” as any of the named Fintechs.
But the 43% statistic is provably wrong. I covered this whole topic in my post on a A New Measure of DDA Primacy – which I will update with the latest NACHA Top 50 data when it comes out.
Balances: The insurgents don’t have high balances
If the insurgents are indeed taking such a high share of new Checking Accounts, you would expect to see high balances at the BIN-sponsors. Spending accounts still want FDIC insurance, so the Fintechs need to park their balances at a chartered financial institution. Since we know who the BIN-sponsors banks are, we can check Call reports to see the balances they hold.
An interesting consequence of the Durbin amendment is that in order to qualify for Exempt interchange, a BIN-sponsor must have less than $10B in total assets. Therefore, our five BIN-sponsors each can’t have more than $10B in assets. Any larger and their Fintech clients lose exempt status. In fact, they are all much smaller.
Total Deposits from 2024 Q4 Call Reports ($B)
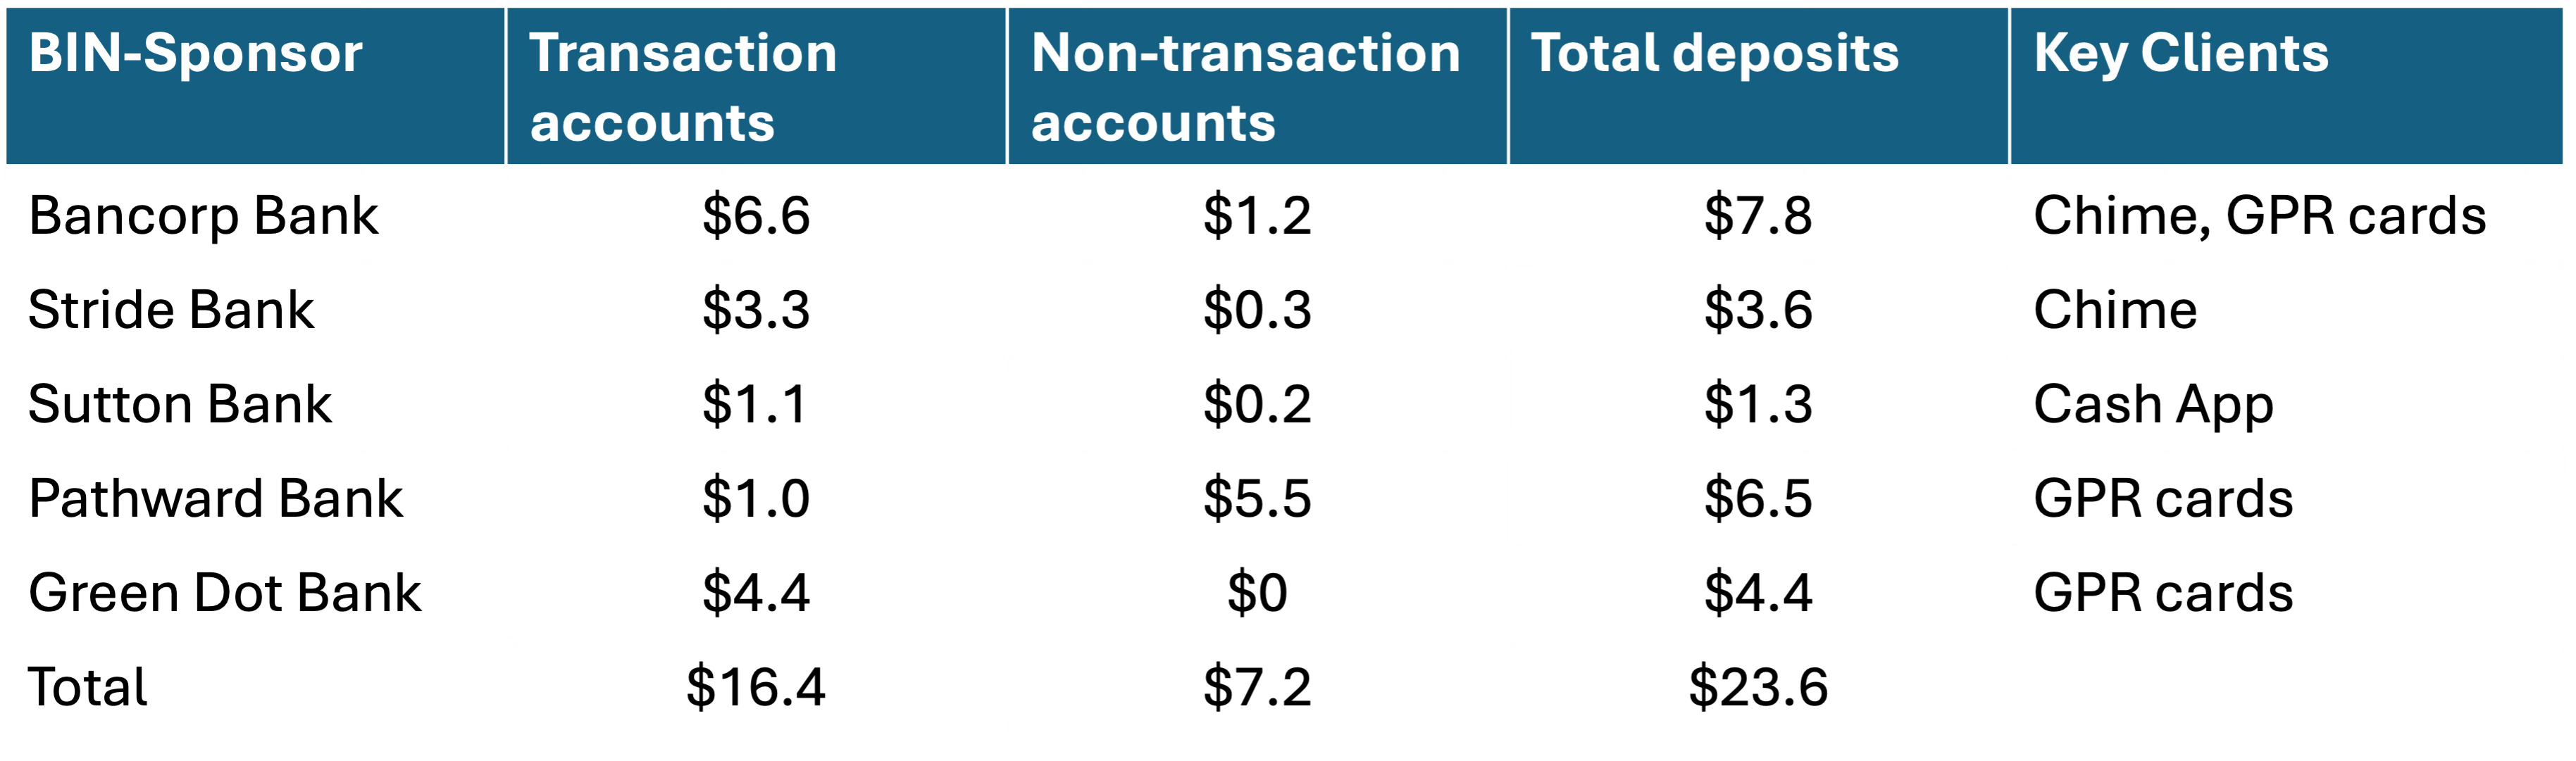
Collectively, these 5 have $16B+ in transaction balances and another $7B+ in non-transaction balances. These are not big numbers, and more than half is in GPR specialists.
The growth [not shown] relative to 2023 is even more revealing: A total of $1B. If the survey is correct, over 40% of new accounts led to only $1B of new balances. Most of that likely accrued to Chime as their two sponsors, Stride & Bancorp, are the only two that grew materially — $1.3B between them, but Chime is not their only customer.
In fairness, this excludes some P2P balances that PayPal, Venmo & Square keep on balance sheet. These amount to $4B for Square for example. In addition, some BIN-sponsors offload deposits to other banks to stay below Durbin thresholds. It is not clear whether any of these BIN-sponsors are doing that. None of them are particularly close to the $10B asset ceiling that would force their hand.
It seems very unlikely to me that 40%+ of new checking account originations leads to only $1B of net new deposits.
Debit: These spending accounts don’t spend much
The survey redefines checking accounts as spending accounts, so they must have lots of spending, right? The three ways to spend are Debit Cards, Direct Debits and P2P. Checks are not offered by nonbanks and cash is diminishing on all accounts.
For both Debit Cards and Direct Debits, the nonbanks have to go through the BIN-sponsors whose volumes are available from third-party sources. P2P volumes are also in the public domain. Let’s look at each in turn:
Direct Debits
Direct debit, i.e., Autopay, is the reverse of direct deposits – the biller pulls the money out of your account every month. Lower-income consumers don’t use autopay much because they risk an NSF for insufficient balance. But this is still worth checking off our list.
NACHA publishes a list of the top receivers of direct debits so we can check how high our BIN-sponsors rank. Collectively, Bancorp, Stride, Sutton, and Pathward account for 0.8% of received direct debits. In comparison, Bank of America alone accounts for about 11% with JPM and Wells close behind. Those using nonbank spending accounts just don’t pay their bills via autopay.
Debit Cards
Every year the Nilsen Report publishes a league table of the biggest debit card issuers, so if consumers are actively using nonbank debit cards, we should see evidence in that table. We don’t. Note that the latest Nilsen table was published last May based on 2023 data. Given what we have seen elsewhere, I don’t think the answer will change much when the new table comes out.
First of all, only 3 of our 5 big BIN sponsors show up in the table, Stride and Sutton are missing. That may be because they weren’t captured or because they are just too small. However, the bottom end of the table is very small indeed.
The three that are listed (Bancorp, Pathward, and Green Dot), collectively account for about 6% of spend, but that breaks down to under 2% of Debit spend (mostly Bancorp) and ~67% of Prepaid spend. Prepaid spend must be the vast bulk of nonbank spending accounts. Overall, this prepaid spend is around 4% of total spend in the table.
If nonbank spending accounts have captured 40%+ of new accounts for the last several years, they are not being used much for actual spending.
But what about growth?
In purchase volume, Pathward & Green Dot declined at double digit rates. Bancorp rose about 11%, with Chime growth likely offsetting GPR decline. The three of them where collectively down 20%+
In cards issued, which is a better measure of account growth, it is a more nuanced picture.
Overall the three lost 2M cards, but Bancorp (Chime) was up by 6M while the other two were down
Almost all the top 50 incumbent banks grew debit card counts, but many actually saw material declines in prepaid
True debit cards were up ~15M collectively
Prepaid cards were down ~23M collectively
I think this reinforces the picture that old-style GPR is a share donor to Neobanks, but the so-called spending accounts are not taking share from incumbent checking accounts.
P2P
The spending accounts metric includes Venmo & Cash App which are, first and foremost, P2P systems. Both also have debit cards, but the bulk of spending on both is P2P. In contrast, the incumbents almost all use Zelle, but Zelle is built into bank apps, so the consumer does not have to sign up independently. As such, it wouldn’t show up in the survey in question. We have some metrics to compare P2P vendors:
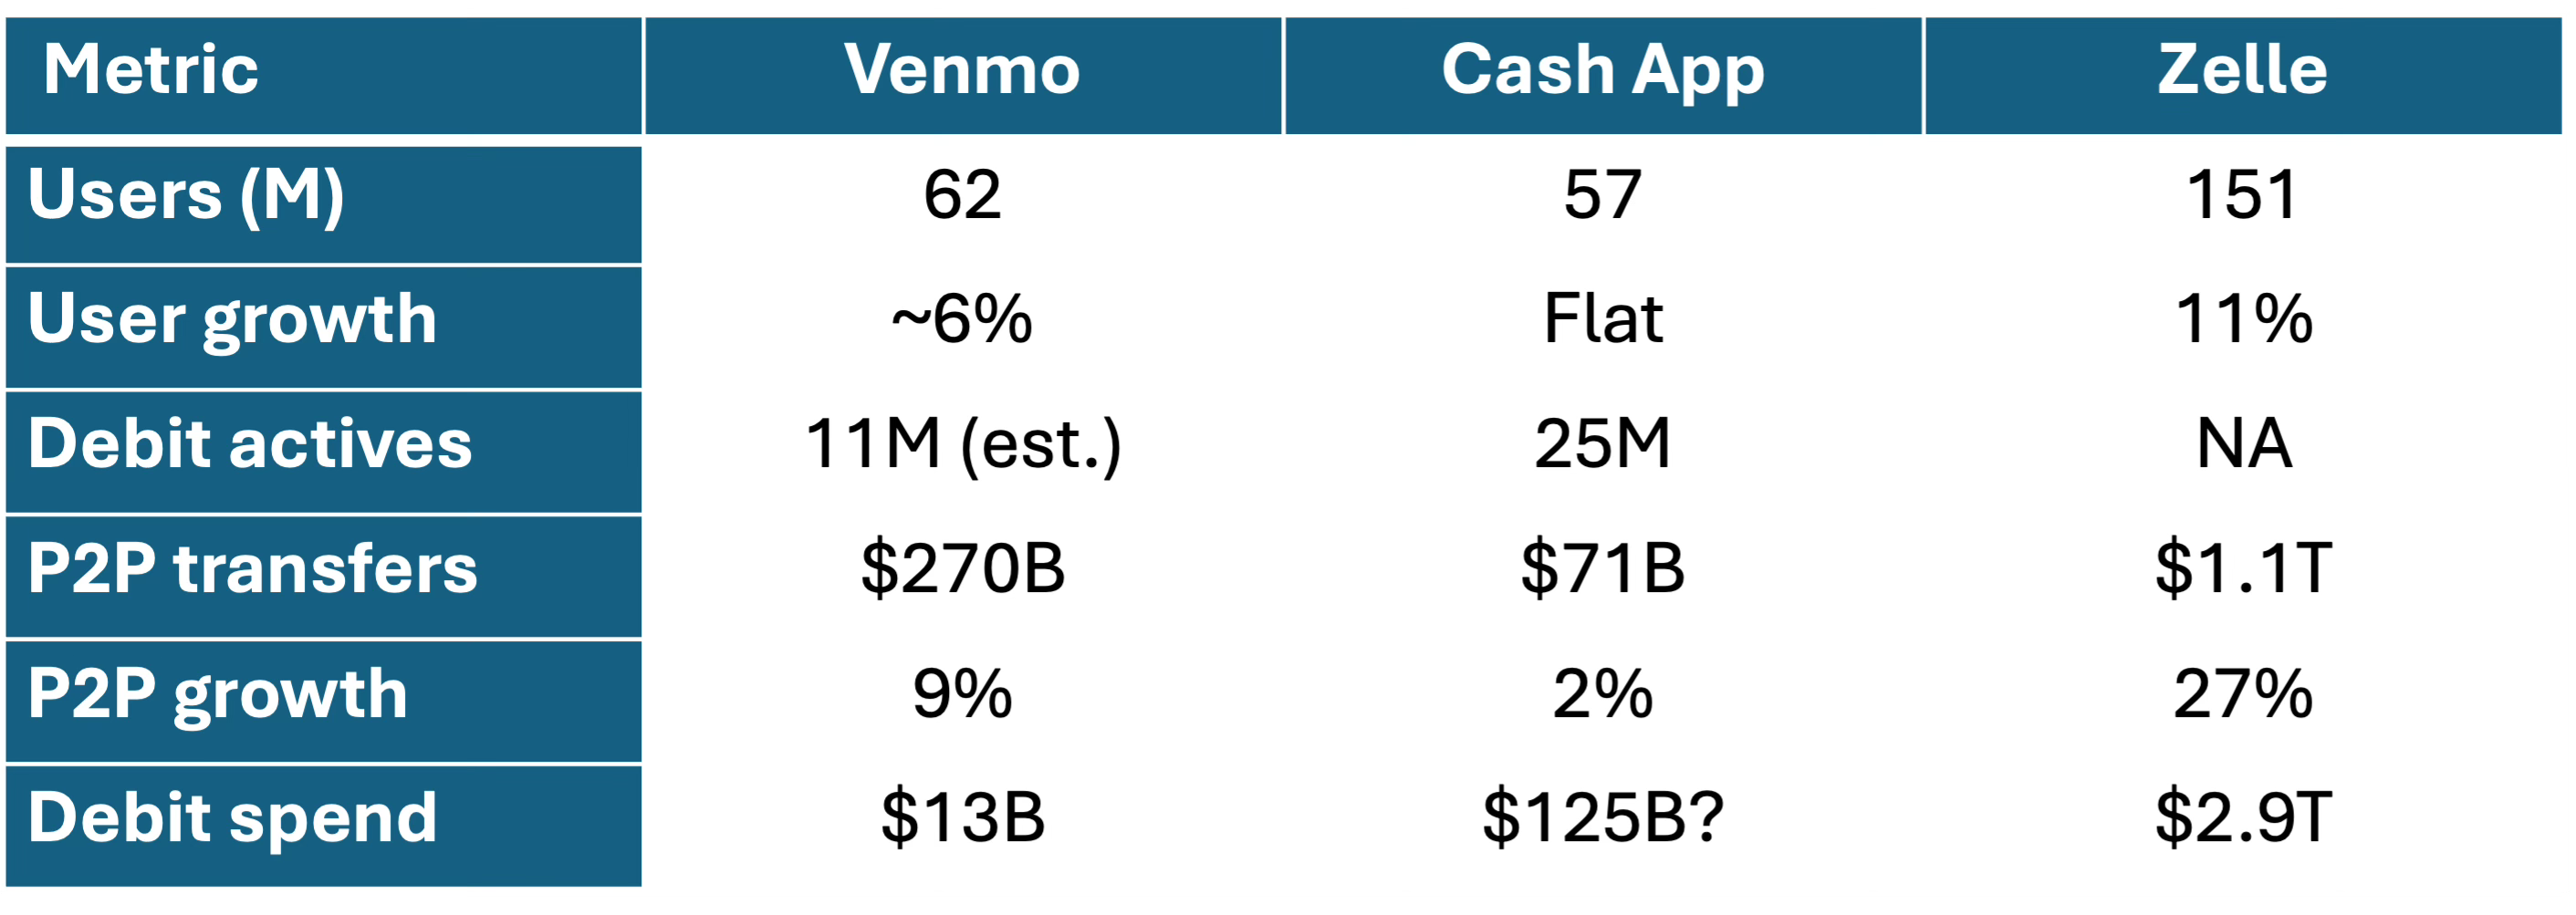
But, you see the conceptual challenge. Zelle added ~15M users last year while Cash App and Venmo combined added around 4M. But the Zelle additions don’t count towards new spending accounts in the survey while the other two do. Yet, all do the same P2P function.
Zelle is growing users 2x faster and volume 3x faster – from a much higher base. Excluding Zelle from the survey biases the analysis towards slower-growing Fintechs. Further, the debit cards from true checking accounts dwarfs the debit spend from P2P services. I cheated a little as the Debit Spend number for Zelle is all incumbent debit spend. Cash App has an impressive business among unbanked consumers, but it doesn’t really compare. And this is without including credit cards — also a “spending account”.
Conclusion
The social sciences face a “replication crisis”. Scientific research should get the same results when you repeat the experiments using the same techniques, but this is not happening enough in social science. Depending on the discipline, half or more of the findings don’t replicate. Payments research is usually done under far less exacting standards than social science research, so we should not be surprised that a lot of it is flawed.
I am certain the authors of this study had good intentions going into it. I have done a lot of surveys like this myself, and there is never enough time or money to get a perfect survey instrument and quality sample. You just make do with the resources you have.
This survey in particular has critical flaws that undermine its findings:
It’s definition of checking accounts is eccentric. Why not just call them spending accounts or auxiliary accounts?
It excludes key types of spending accounts that would change the key finding, in particular, it excludes credit cards, Zelle, and GPR cards
It wasn’t sense-checked against readily available, public data sources, which clearly refute the findings
If you buy my critique, the 44% headline evaporates. Instead, the “digital banks and Fintechs” are mostly taking share from GPR cards not banks, and Zelle has captured most of P2P growth. Credit Cards are still how the creditworthy spend.
The survey write-up also notes that the biggest banks are gaining share at the expense of the smaller banks, and I also document that finding. I will update that work within the next 2 weeks when the 2024 NACHA Top 50 table is available.