

Decoding PayPal engagement
Commerce engagement is a fraction of reported engagement

Key insights in this post
PayPal publishes an engagement metric in two forms:
Transactions per Active Account (TPA), which includes “unbranded’ Braintree transactions in the numerator. This has always been in PayPal disclosures. For FY 2023 this was reported at 58.7
Transactions per Active Account ex PSP, which excludes Braintree (P2P is Payments Services Provider). This was added in FY 2023, where the metric was 33.5
In 2023 they also stopped calling either metric “engagement”
Even TPA ex PSP has issues in the numerator and the denominator
The numerator mixes PayPal wallet transactions with Venmo and other transactions
The denominator includes any account that did one transaction within the last 12 months, which is not particularly active
Both metrics are only reported on a global basis which masks regional differences
I have used other PayPal data plus some average ticket assumptions to estimate engagement on PayPal wallet commerce transactions, which is the primary way PayPal earns revenue:
PayPal wallet activity is estimated to be under 20 transaction per year with only 10 of those being revenue producing commerce transactions
10 commerce transactions per active account per year
8-9 P2P transactions per active account per year
Venmo increases the average as a Venmo account does an estimated 78-94 transactions per active account per year
This data depends on estimates of average ticket for P2P and Commerce and critically on the number of Venmo active accounts
PayPal is rolling out strategies to address this issue and we might see progress in the 2024 FY reporting in a few weeks
Introduction
While I was researching the PayPal vs. Apple Pay post, I read through PayPal’s investor reporting. I was reminded how improved their disclosed metrics are; but, their engagement metrics still mask performance at the individual product level. In particular, no metric discloses commerce engagement on PayPal wallet. Fortunately, they now disclose enough other data for me to estimate that engagement, and the results are interesting.
This post will walk through why this has been an issue historically, how the disclosures have improved, and my math for extracting commerce engagement. Note that I made a lot of assumptions. The accuracy of my estimate depends on how well those assumptions reflect reality. If you have different assumptions, you can replicate my models to come up with your own estimates.
How PayPal reports engagement
Engagement is an important indicator of wallet performance. It measures the number of times per year that a user transacts. That is not what PayPal’s engagement metric reports. They report “payment transactions per active account (TPA).” They stopped labeling this “engagement” in 2023, but did so prior to 2022.
TPA has issues in both the numerator and the denominator. In the numerator, PayPal lumps together PayPal wallet transactions, Venmo transactions (P2P), Xoom transactions (FX), Braintree transactions (basic acquiring), etc. Here is the official description from the last 10K:
Numerator: “Number of payment transactions are the total number of payments, net of payment reversals, successfully completed on our payments platform or enabled by PayPal via a partner payment solution, not including gateway-exclusive transactions.”
This biggest issue is Braintree transactions, which are basic acquiring that does not involve the branded consumer accounts at all. Even PayPal calls these “unbranded” transactions.
The Active Accounts definition in the denominator also has issues:
Denominator: “An active account is an account registered directly with PayPal or a platform access partner that has completed a transaction on our platform, not including gateway-exclusive transactions, within the past 12 months.”
If a bank had a checking account that did only 1 transaction per year we would think of it as dormant, but PayPal calls similar accounts “active”.
Both the denominator and the numerator are inflated, having opposite impacts on the metric itself. The numerator inflates engagement by including non-consumer transactions while the denominator deflates engagement by including so many low-engagement accounts. The result tells the reader nothing useful.
“Number of payment transactions per active account”, for 2023 was 58.7, up from 51.4 in 2022. This reflected a decrease in active accounts of 2% and an increase in transactions of 12%. The transaction growth came from unbranded Braintree transactions and the loss of active accounts means consumer share is dropping. That is not a positive outcome.
Thankfully, the company started reporting a second PTA metric without Braintree in the numerator. Happy day! The metric is called “TPA ex PSP”, i.e., without Braintree, which is a Payment Services Provider (PSP). TPA less PSP is 33.5, just over half of TPA. But 33.5 still seems high if we want to track revenue-producing commerce transactions on the PayPal-branded wallet.
Remember that PayPal has limited volume in the in-person venue, and are losing share to Apple Pay In-app. I covered this in the PayPal vs. Apple Pay post a few weeks ago. In their bastion of browser-based eCommerce, they are disadvantaged in over half the market:
PayPal can’t be used at Amazon which may have 40-50% eCommerce share
PayPal are implicitly steered against within the Shopify, eBay & Apple ecosystems which collectively have over 15% of eCommerce
33.5 transactions per year translates to just under 3 per month, and those are executed within the 35-55% of eCommerce spend that is not Amazon, Shopify, eBay or Apple. I find that unlikely.
My issue is that TPA metrics include Venmo accounts which have much higher engagement but much lower revenue. Most Venmo transactions are free P2Ps that do not generate any revenue. Furthermore, a share of PayPal wallet transactions are themselves P2P (PayPal discloses that figure). Since Venmo is outgrowing PayPal, the TPA metrics rise faster than revenue: Profitless transaction growth.
The engagement metric we want is the number of PayPal wallet commerce transactions divided by active PayPal wallet accounts. Those are the bulk of revenue generating transactions. I believe I have derived that metric from disclosed data and some external research. I made some assumptions that could be wrong, but I think the outcome is directionally correct.
Calculating PayPal wallet commerce engagement
Happily, PayPay reports Total Payments Volume (TPV) at the product level. For FY 23 Total TPV was $1,529B. The downside is that this is a global number rather than US only. They report US TPV, but not at the product level. What we care about is “Branded checkout ex P2P” – these are the commerce transactions. Venmo and Other P2P collectively comprise 26% of TPV – almost as much as the commerce wallet – but neither of these earn much revenue. The biggest TPV component of the rest is Braintree/unbranded. The derived TPV for our target products is as follows:
FY 2023 PayPal TPV metrics from Earnings Presentation
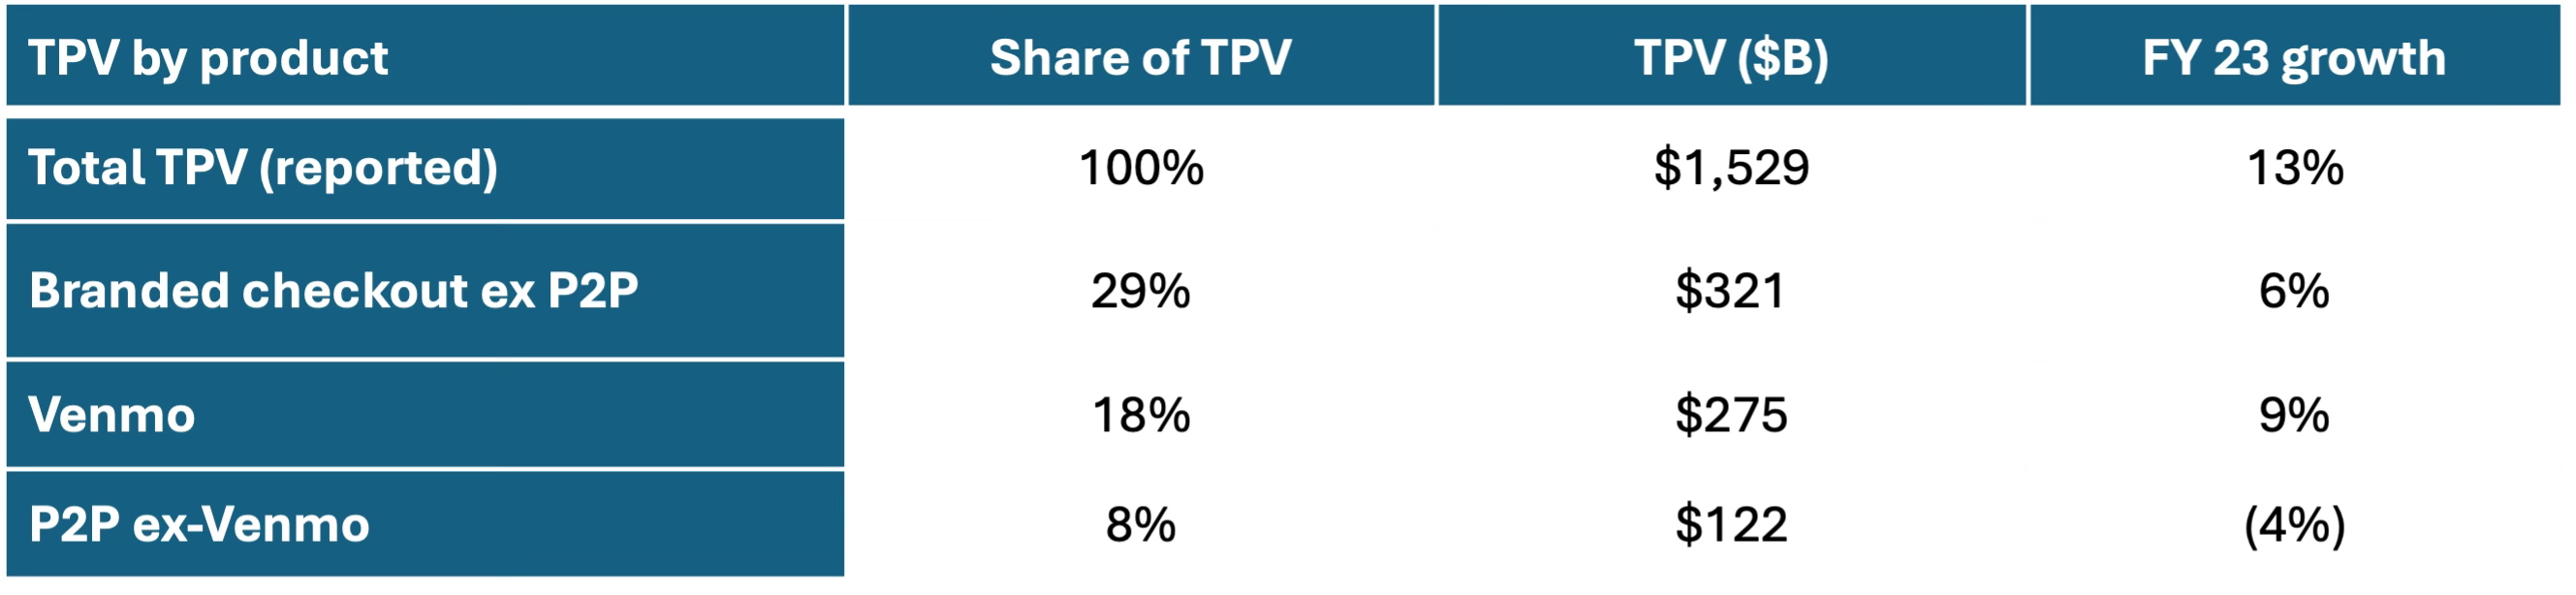
Low-revenue Venmo is outgrowing PayPal, which means TPV grows faster than revenue. Total TPV is outgrowing all consumer facing products because Braintree/Unbranded grew at 30%. Interestingly, the two P2P rows account for almost as much volume as the revenue-producing branded checkout row.
Our next task is to determine accounts. FY 23 active accounts are reported as 432M. Venmo actives alone are not disclosed. I have found a range of third-party estimates for Venmo actives of 73M-88M. The lower end would inflate engagement while the higher end would deflate it. At the low end we get 73M Venmo and 359M PayPal accounts, at the high end we get 88M Venmo and 344M PayPal accounts. Either way, PayPal is 80%+ of active accounts.
Dividing TPV by actives gets us TPV per account. For Venmo, this works out to $3.1-3.8K annual TPV per account. For PayPal we need to add both their commerce and P2P TPV to the numerator. That gives us only $1.2k-1.3K per account annually, depending on which Venmo estimate you believe.
We next translate those spend metrics into transaction counts. The objective is to reconcile to the 33.5 “TPA ex PSP” that PayPal discloses. To translate TPV to transactions we need to estimate average ticket size:
For the PayPal commerce volume I used the average credit card transaction size of roughly $90
For the two P2P products I triangulated to $40 per transaction, which isn’t far off from I gather from third-party sources
Note that I use the same average ticket for PayPal-branded P2P as I do for Venmo.
At these values, we get 78-94 annual Venmo transactions (6-8 per month). PayPal actives generate ~10 commerce transactions and 8-9 P2P transactions per year – less than one per month each. That produces average annual TPA ex PSP of 31-34 as PayPal defines it -- close to their published metric of 33.5.
The key insight here is that revenue-producing TPA on PayPal wallet commerce transactions is 10, not 33.5 or 59. This conforms with the answers I get from users when I ask them how often they use PayPal. Yes, I am annoying like that.
Another point worth making is that not all those transactions are generating “engagement”. Many PayPal transactions are embedded in venues like the Starbucks app or Uber. This is the equivalent of Card-on-file in the credit card world. Embedding does anchor loyalty as it is cumbersome to unwind, but it doesn’t get actual engagement as embedded is set and forget; in other words, the consumer doesn’t choose PayPal in the moment.
Coincidentally, I was on the phone last week with a colleague and asked about their PayPal usage. They said four times a year, and those four transactions were in an embedded venue that offered payouts only by PayPal wallet or checks. This anecdote reinforces the “home field” advantage point I made a few weeks ago. My colleague has to use PayPal here if they want to stay electronic. They volunteered that they didn’t use PayPal for anything else and that most of their other eCommerce is on Amazon or Shopify — where they use One-Click and Shop Pay.
As a cautionary note, the TPV estimates are global but Venmo volume is virtually all US. Global average tickets are also likely lower which would drive global wallet commerce transactions higher, but higher global engagement averages would drive US commerce engagement lower. This is a squeeze the balloon exercise — there are only so many transactions, so if you increase them in one product or region they have to decline elsewhere. Without more disclosures, I can’t estimate these impacts more accurately.
By Q3 24, TPA ex PSP had increased from 33.5 to 34.5. PayPal explains this as follows (I am paraphrasing):
Venmo is outgrowing PayPal wallet (9% vs. 6%). This shifts the TPA mix towards engaged Venmo accounts
Active accounts declined 2% YoY, which PayPal attributes to “churn of unengaged accounts”. Purging those accounts raises TPA without any engagement growth on residual actives. It simply concentrates the same number of transactions over fewer accounts.
In other words, this rise in reported engagement is just math.
What are the strategic implications?
We will know more about PayPal’s plans to address all this in February after they release FY 2024 earnings and hold their Investor Day. I do not expect material changes to my analysis since Q3 data was very similar to FY 23 data and growth rates are relatively low in all the relevant metrics. But I will write an update if anything material does shift.
At the highest level, the challenge is that PayPal wallet commerce transactions are not growing as fast as they once did while Venmo transaction growth is still high, but those transactions don’t generate much revenue. So the key questions are:
Can we get consumers to use the PayPal wallet more for Commerce?
Can we get customers to use their PayPal account more often?
Can we get prospects to adopt PayPal?
Can we get Venmo P2P users to use Venmo as a commerce wallet?
(Pay-with-Venmo)
PayPal wallet opportunities
My post from 2 weeks ago, Why is Apple Pay outgrowing PayPal, discussed all this in detail, but here is a summary of the challenges:
PayPal is growth constrained in key venues:
POS, since it can’t yet have an NFC wallet on iPhones
In-app, given Apple Pay advantages through IOS/App Store
eCommerce, because Amazon, Shopify, eBay & Apple steer to their own payment methods
PayPal has no “home field” to generate new users and activity. eBay used to serve this purpose but no longer does; Shopify leads among small merchants – and while Shopify accepts PayPal (and Apple Pay) it promotes Shop Pay
Guest checkout has become a battlefield where PayPal previously stood alone. Apple Pay, Shop Pay, Paze, Google Pay, Stripe Link and others all now compete
eCommerce growth has slowed from historical levels. It is still higher than POS but by a smaller gap
Apple’s open-NFC initiative will help PayPal wallet engagement if PayPal adopts it. PayPal will have access to the huge in-person (POS) market. However, they will still have to convince consumers to use PayPal NFC rather than Apple Pay or Google Pay which are built into the phone and work just fine. I cover the challenges here in my post Who benefits from Apple NFC access?
One options is a rewards play. Today, PayPal is promoting a debit card with a 5% rewards category, a proposition that could port to an NFC wallet; the risk is that consumers use the wallet only in the 5% category, making the proposition uneconomic.
While NFC solves the technical acceptance problem, PayPal would still have to establish settlement arrangements with each merchant to preserve margins. It has a few options here:
It could contract with each merchant to negotiate an MDR – which is slow, but replicates how PayPal operates online
It could act as a pass-through wallet, like Apple Pay, which gets engagement but limited revenue, unless the consumer pays with a PayPal balance
It can use a high-IC virtual card, which has an attractive interchange rate, but will be vulnerable to steering if the Merchant Settlement eliminates “honor all cards” (see this post on the merchant settlement for more details)
Pick your poison. Further, Apple will charge for access, which will make NFC transactions less profitable than eCommerce transactions.
In terms of a new user pipeline, there is no obvious solution. I can’t think of a big enough “home field” that doesn’t already have a wallet partner and might favor the PayPal wallet. If one were out there, they might demand a very high revenue share or a very low MDR. That leaves direct to consumer marketing, which is expensive and uncertain.
No easy answers here.
Venmo commerce opportunities
Since Venmo is outgrowing PayPal wallet, one way to solve the growth gap is to get more revenue from Venmo customers. Today, Venmo generates revenue in a few ways.
Venmo charges for real-time money movement back to your checking account. At one point this was the primary source of Venmo revenue. Of course, using Zelle avoids this cost as Zelle always settles into the checking account for free; this Venmo fee effectively creates an economic incentive to use Zelle. It is unlikely that this fee source has been growing
Venmo has a debit card, which earns interchange revenue. It is not clear how widely used this is. Venmo has an enviably young and affluent customer base that is likely credit card centric. Further, all Venmo customers already have checking accounts that come with a free bank debit card. To distinguish itself, Venmo’s card offers a rotating portfolio of merchant-funded discounts, but using this requires the consumer to keep money in their Venmo stored-value account rather than consolidate funds in their Checking account. Most banks also offer merchant funded rewards through Cardlytics. Venmo’s debit card may appeal to some customers, but it would be a narrow slice
Finally, PayPal could grow Pay-with-Venmo. Venmo’s demographic likely does a lot of eCommerce. But that same demographic are already the heaviest users of Apple Pay and carry rewards credit cards. So the challenge is: Why use Pay-with-Venmo rather than Apple Pay or direct cards? I have often speculated that the real purpose of the real-time fee is to encourage customers to use Pay-with-Venmo to unload any accumulated balance. Paying with a balance is the highest margin payment method PayPal has
Pay-with-Venmo benefits from the PayPal acceptance footprint but likely has not converted enough P2P customers into commerce users. If it did, PayPal would no doubt disclose it. Pay-with-Venmo has occasionally run promotions, which creates lots of short-term activity but few long-term converts. Users opt-in for the promotion and then revert to prior behavior. This is likely what happened on Amazon where Pay-with-Venmo was briefly accepted and then quickly turned off.
Without converting Venmo into a primary bank account or primary credit card, it is hard to see how Pay-with-Venmo takes much share. Venmo may also move to NFC, but with the same challenges as PayPal wallet.
Conclusion
PayPal has an engagement challenge. While it reported “payment transactions per active account ex PSP” of 33.5 in FY 2023, this metric overstates revenue-producing engagement. My adjustments, based mostly on their data, estimate fewer than 1 revenue producing transaction per month per active PayPal account.
The challenges in growing this metric are the constrained commerce footprint that PayPal operates in, and the fact that active accounts are not growing. The solution to both of these is either to find a commerce venue that is willing to embed PayPal as their own wallet or spend a lot more on direct-to-consumer marketing. Adopting the iPhone NFC option may help, but comes with its own challenges.
Invigorating Pay-with-Venmo is another opportunity, but Venmo users have many other ways to do commerce with credit cards and other digital wallets. Further, Zelle has been eroding Venmo growth, so new customers may be hard to come by in the future.
This may be too dour an analysis. I am prone to that, so I could be wrong.