


Treasury Services is concentrating
The Big 3 capture large corporates, but banks serving Fintechs are growing faster

In a prior article, I used NACHA’s Top 50 ACH Receive Credits data to show how the largest banks are taking retail DDA share despite inroads from Digital specialists – and that regional banks are share donors to everyone else. In this post, I use the same data source to show concentration trends in Treasury Services (TS). Here, we will use ACH Origination volumes, both Debits & Credits.
Why bother? Some annual surveys rank and rate TS banks, but all of them require subscriptions. Some database services, like Portfolio Navigator from McKinsey, use contributed data from TS banks, but results are only available to those banks. No public source is available. I wanted to see what you could learn about share and trends from a free, one-page data sheet that NACHA publishes annually.
Note that all my analysis is merger adjusted, but only within the NACHA table. For example, I added the 2019 volume of BBVA to PNC and the 2019 volume of MUFG to USB. Several banks acquired a smaller competitor, but that competitor was too small to make the 2019 top 50 list; as one example, Huntington acquired TCF. That means some nominal growth at select top 50 banks looks organic but is really inorganic.
While a receiving ACH bank passively accepts transactions, the originating bank initiates money movement on behalf of a client or themselves. Debits pull money from other banks and Credits send money to other banks. The debits are typically for Bill Pay, while the credits are payables activity, including accounts payable (B2B) and disbursements (B2C). Credits also includes Zelle settlements (bank-to-bank).
I segmented the top 50 by business model. The segmentation for Originators is more complex than it is for Receivers because different factors drive Debit & Credit rankings. The Big 3 and the BIN-sponsor segments are consistent. The prior Remote segment is now the Consumer Lenders segment – it is largely the same banks, but their Debit volumes are driven by on-us bill pay while they typically have low Credits volume.
The main difference is for the Regionals, which I fragmented into three segments:
Wholesale banks like State Street & Bank of New York (BNY) have low Debits volume but higher Credits volume. These banks did not even appear on the Receivers table I analyzed in the prior article as they have very low consumer volume. They also have minimal Zelle volume
Fintech Specialists have meaningful business units processing for Fintechs. This segment includes only three banks: Fifth Third, Citizens, and First Citizens. The First Citizens volume is a legacy of its Silicon Valley Bank acquisition (SVB)
Regionals include all other incumbent banks. They typically get their TS volume from lending clients rather than from mono-line payments units. These banks are typically balanced across debits and credits, but smaller on both than the leaders
The anomaly is Citi. The are #4 on the Debits table – slightly behind Bank of America and slightly ahead of Capital One; but, they are #7 on the Credits table and notably smaller than #6. Citi’s TS business focuses on Multinationals, where the bulk of payments are cross-border or outside the U.S. entirely; that makes them a relatively modest domestic competitor. Their growth rate is just “in-the-pack”. I put them in the Consumer Lender segment for Debits but in the Regionals segment for Credits. In truth, they are a segment of one.
Overall, the market is concentrating along three broad dimensions:
Large corporates are migrating to the Big 3. That volume is coming from the Wholesale and Regionals segments. For Big 3 advantages in scale/price, service breadth, and cross-border support
Consumer Lenders are outgrowing other segments on the Debits table because consumer lending itself is concentrating. These bank process their own Debits, not third-party volume; this segment is much smaller in Credits
Fintech demand is flowing to banks that focus on serving them. Not every bank is willing to serve Third-Party Processors (TPPs) due to the compliance requirements. Both the BIN-sponsors and the Fintech-specialists accept this trade-off and outsized growth as a result, mostly at the expense of regionals. Although growing fast, volumes in these two segments are modest overall
Originated Debits
Originated Debits are not a pure measure of Treasury Services performance. They are largely used for Bill Pay (direct debits). Share positions and growth are a function of on-us loan payment volume and/or off-us bill payment volume from non-banks.
Banks with big consumer asset portfolios originate direct debits to help their own borrowers pay monthly bills. The Consumer Lenders are outgrowing other segments because they are taking share in cards, not because they are growing TS volumes. For example, Capital One is #5 in debits, but #12 in credits; They have 6.1% share of debits but only 1% share of credits. Goldman Sachs was not even on the 2019 list but is #11 on the 2023 table due to its Apple Card volumes; in contrast they have minimal credits volume.
JPMorgan is 2nd on both lists and Bank of America is 3rd, but on Debits JPM is over 3x larger than BAC while on credits they are roughly equal. That reflects the relative size of their card portfolios. Wells leads both lists, likely because they worked with major Fintechs in this period. The table below shows the outcome by business model, based on my idiosyncratic assignment of Originators to segments:
ACH Debit Originations by business segment
(2019-2023, merger-adjusted)
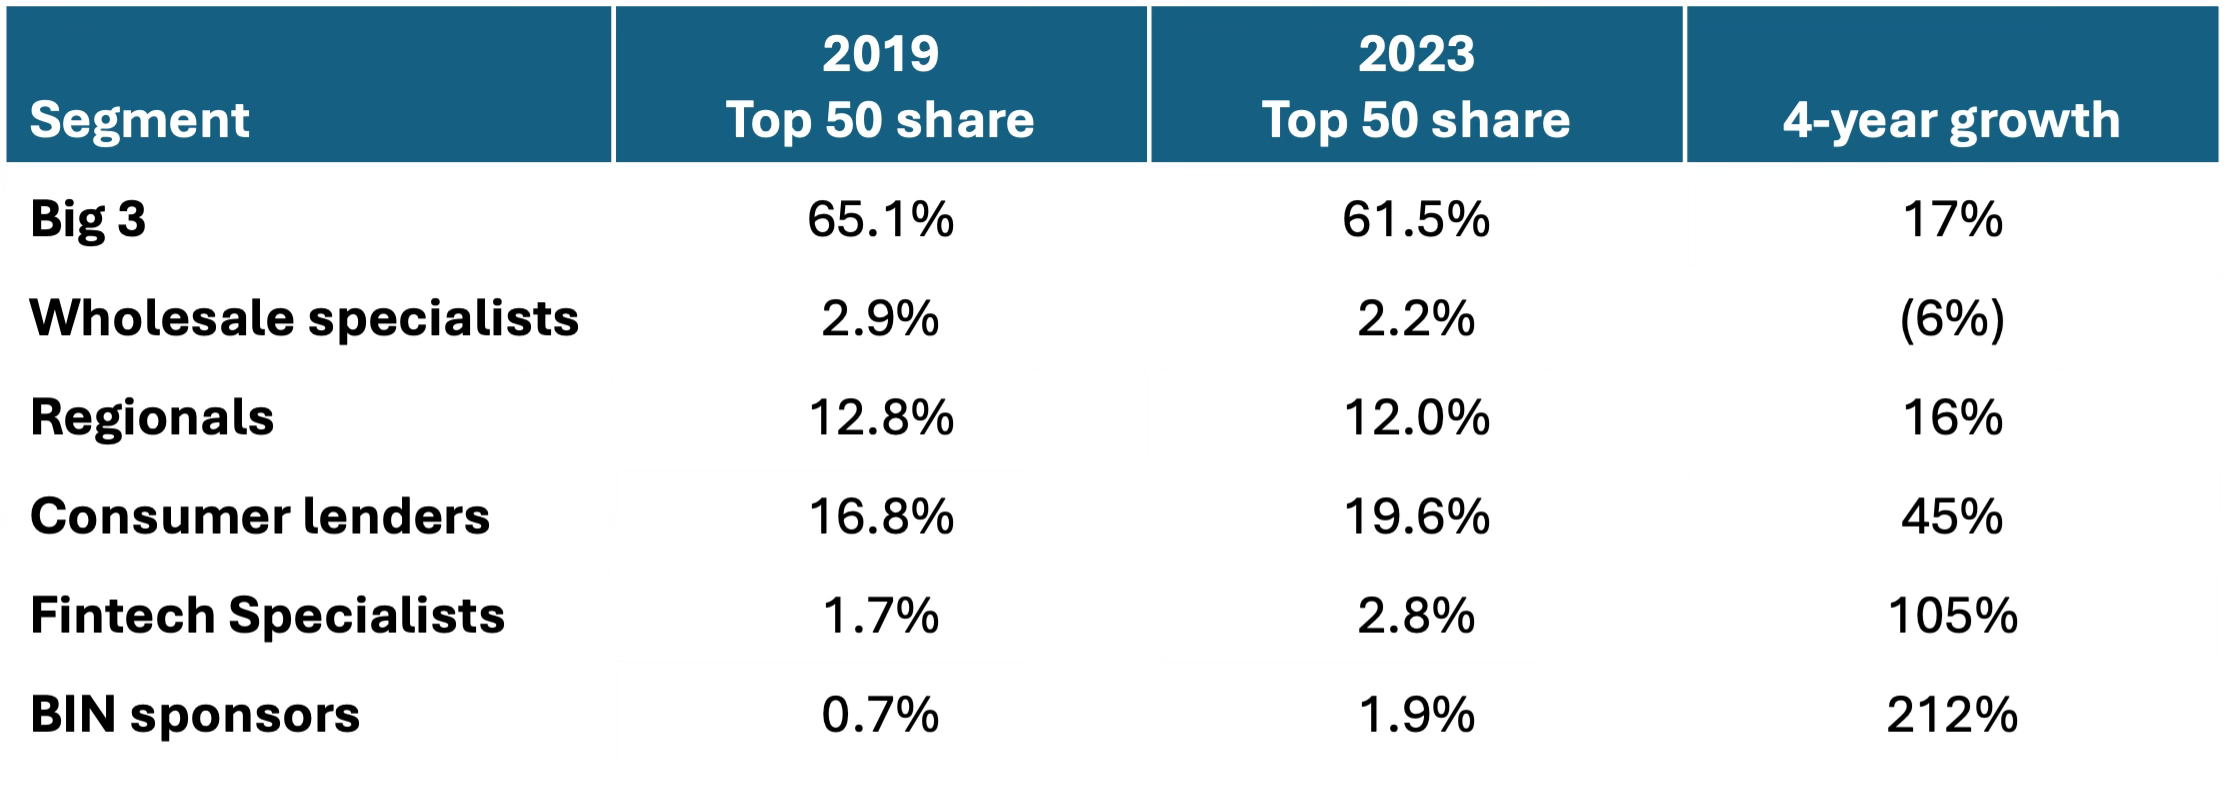
The big three are all big consumer lenders and collectively aggregate the bulk of non-bank biller volumes from telcos, utilities, etc. Within the big 3, BAC is much smaller than the others.
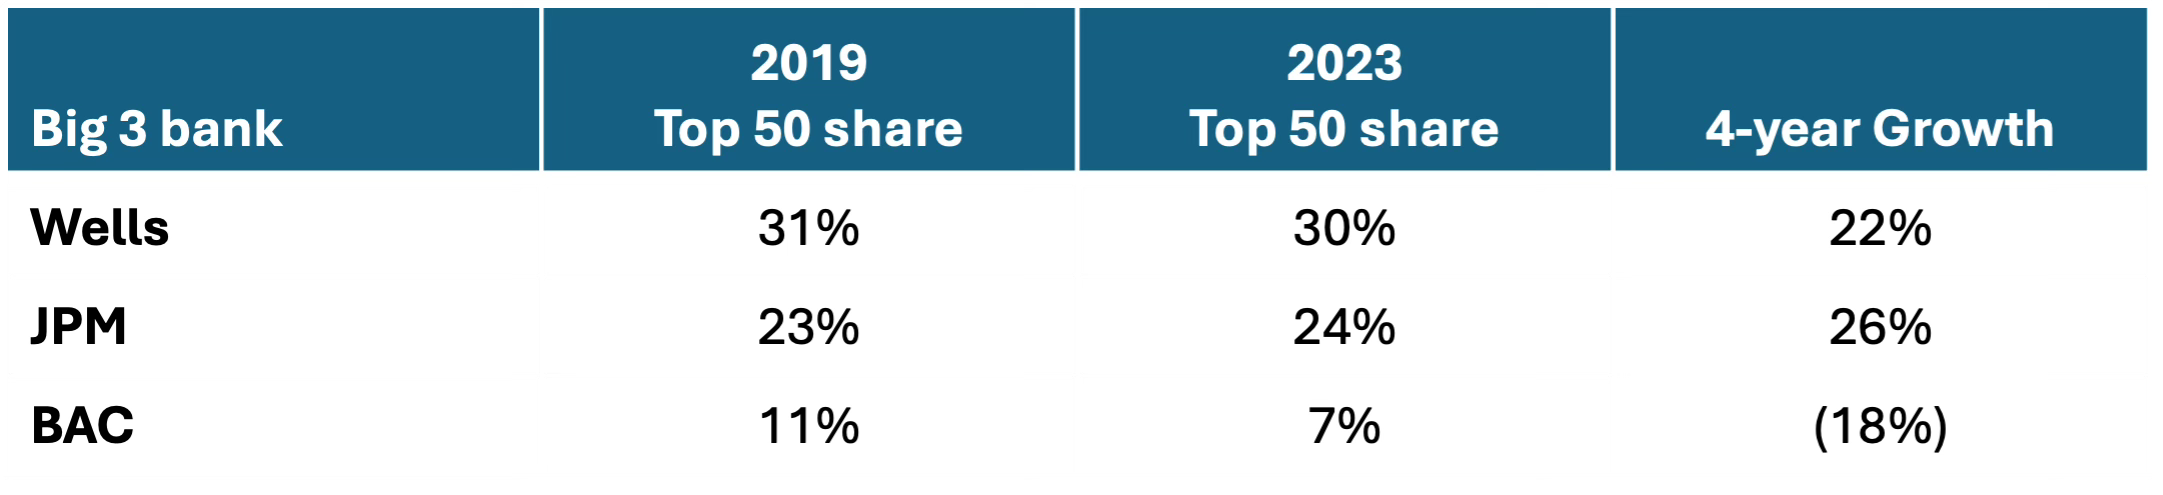
BAC seems to have lost a big client or exited a segment back in 2019 and Wells may have been the beneficiary – but the volume stayed in this segment. In more recent years, JPM has outgrown the other two. The Big 3 also seem to have absorbed share from the declining Wholesale Specialists.
The two fintech-focused segments both grew at triple-digit rates. Within each segment there is considerable concentration. Fifth Third accounts for two-thirds of the Specialist segment and grew 130%+ over the three years. Pathward leads growth among BIN-sponsors on the 2019 list, but neither Evolve nor Cross-River where even on the 2019 list yet are now as big as Pathward. Effectively, their growth was infinite.
These two segments collectively process under 5% of total volume. The Big 3 also process for some Fintechs, particularly Wells, but even then, the Fintech challenge in TS is just not as profound as the hype would suggest — at least on the Credits side.
The BIN Sponsors benefitted from the tailwind of Neobanks & GPR growth in the pandemic; That wave may have peaked early in the analysis period: The two biggest originators Bancorp Bank & Pathward barely grew from 2022-2023.
The biggest share growth is from the Consumer Lenders which includes Citi, Capital One, USAA, Navy, Goldman, Synchrony and several small, high-growth subprime specialists. These volumes are on-us, rather than won in the open market. These originators all have substantially less Credits activity. Goldman is now exiting consumer, so all their volume will migrate to whomever takes over the Apple Card.
Notably, neither Discover nor American Express make the top 50 list, likely because they outsource Direct Debit processing to one of the Big 3 (I am guessing here). If the Discover deal closes, Capital One will insource DFS volumes and leapfrog to 4th or even 3rd place. Whatever Big 3 bank processes for Discover today will take a hit post-merger.
Which brings us to the Regional banks. The 20 regionals collectively have about half as much Debits volume as JPM alone. The segment shows the lowest growth rate and lost share. That is true even though some regionals have hidden inorganic growth in the data, i.e., they bought a non-top-50 bank. As one example, Huntington bought TCF bank in 2020, but TCF was not on top 50 ACH table in 2019.
Regionals don’t have big consumer loan portfolios to drive on-us volume; they largely process for their commercial lending customers who cluster in the middle market. They don’t actively compete for the high-growth Fintech volume. The smaller regionals grew slower than the larger ones. In other words, even in the slowest growth segment, the larger banks are doing better than the smaller ones.
In summary, is third-party volume is concentrating in the Big.3 and Fintech-focused segments, but that trend is masked by on-us processing and inorganic growth.
Originated Credits
ACH Credits have limited on-us volume – with the key exception of Zelle settlements – so nominal share of Top 50 volume is a better measure of TM prowess. The top 15 are roughly the same as the top 15 Commercial lenders and roughly in the same order. in other words, there is no distortion from consumer assets as we saw in Debits.
ACH Credit Originations by business segment
(2019-2023, merger-adjusted)
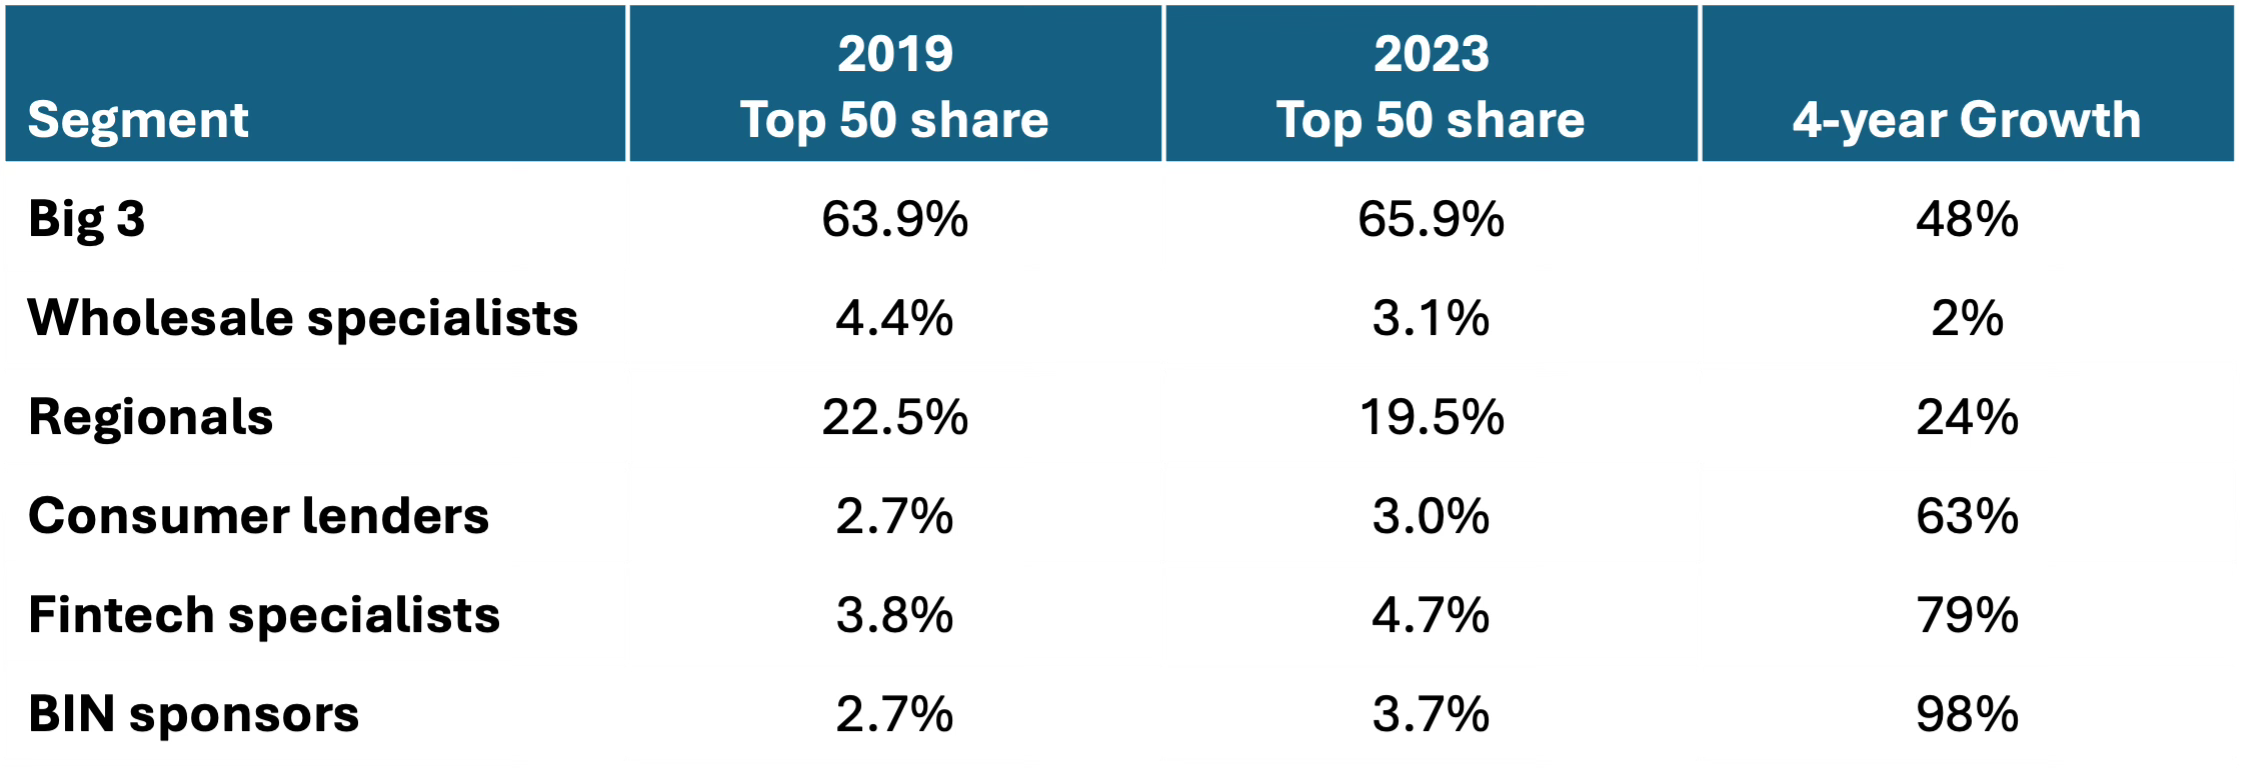
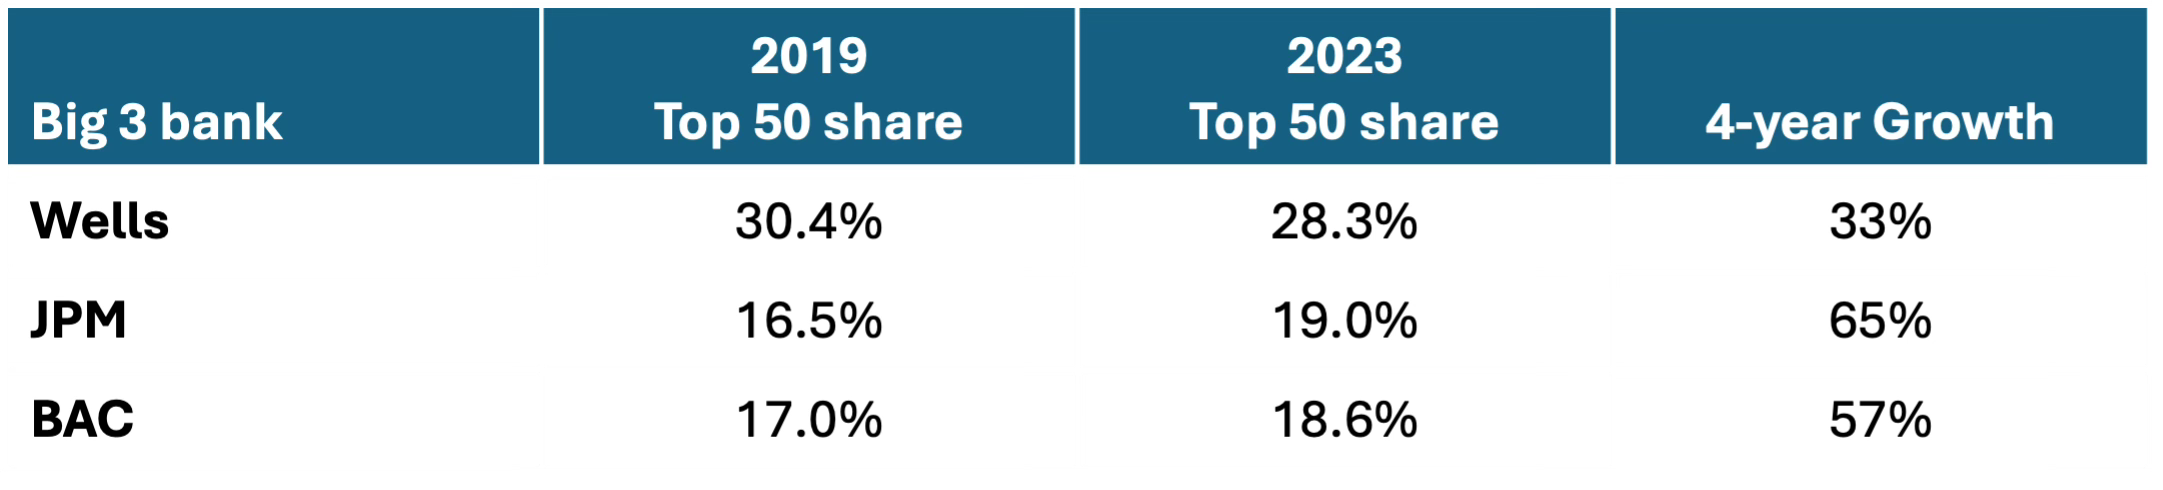
Credits are more concentrated than commercial lending is. The Big 3 have two-thirds of the volume and their share is growing. The largest corporates need Big 3 scale and those companies are likely outgrowing the market overall.
In contrast, the Consumer Assets Specialists, ex-Citi, collectively account for just 3% of this market compared to 19% of the Debits market -- and some of their credits volume and growth are from on-us Zelle payouts. The Wholesale Specialists are fading with minimal growth over the period. The 20 Regionals collectively are about as big as JPM or BAC alone, but with slower growth.
The two segments that focus on Fintechs are growing fast from a low base:
The BIN Sponsors account for under 4% of volume but grew nearly 100% over the 4-year period. This group has a moat in debit card sponsorship by leveraging their Durbin-Exempt status. Bancorp & Pathward exemplify this, but so do Cross River, Green Dot, Evolve, and others. That is a big chunk of segment volume.
The Fintech Specialists are regionals that have invested to serve the Fintech community without lending to them. Their investments includes an API layer and a specialized compliance infrastructure. Fifth Third has 75% of segment volume; 5/3 are #6 on the credits list but grew 171% over the 4-year period – almost 4x market growth and over 3x the Big 3 average. When the 2024 data is published in March, 5/3 may pass USB or PNC despite having less than half their total assets. However, there will still be a yawning chasm to #3. If you read my intro, you know that I now work for 5/3, but I had nothing to do with this growth as I have been here less than a month. The bank grew this business without any help from me!
The Regionals are a share donor. Regionals get their TS business from their middle market lending clients, as a condition of borrowing. Their bigger customers are moving upmarket to the Big 3. Some of those customers use Fintech services on the side – eroding TS volumes even as the relationship stays put.
The summary is that third-party volume is concentrating not just because the Big 3 have scale, but because Fintechs and their processing banks are eroding incumbent volumes. The regionals have a leaky moat in the middle market.
Where Fintechs are succeeding
Fintechs will never appear in these ACH tables because, as you read in my post on “Why Payments Matter”, only banks can initiate ACH [you read that post, right?]. Most Fintechs focus on the digital experience layer, not payments execution or holding balances. They source the actual payments and account services from TS banks. That is why Fintech-focused banks show such high growth – they are processing ACH for high-growth Fintechs. But Fintechs can and do use that experience layer to peel away some volumes and revenues from incumbent TS banks.
Fintech impact depends on the segment they target and the services they provide. Let’s look at some examples by client segment:
Large Corporate
Cross-border is the primary vector where large banks are losing to Fintechs, but only in narrow use cases. For example,
Adyen is a leading cross-border acquirer focused on eCommerce processing
Payoneer delivers a global disbursement product
These companies are not taking the entire TS wallet, but instead carving out certain products or services where they provide a more global service than most incumbents can achieve. A bank will still hold the balances, but transaction volumes will contract.
Middle market
Fintechs serve narrow use cases with a superior digital experience, often tailored by vertical. Some also provide cross-border support. Flywire exemplifies this.
Flywire targets three middle market verticals with FX needs: Health Care (medical tourism), Higher Ed (foreign student tuition), and Luxury Travel (high-ticket, foreign vacations). Flywire differentiates with an end-to-end solution: They have API integrations with the client’s ERP on the receive end while presenting local portals, using local payments methods, to the consumer senders. Their solution displaces Card payments and wires.
The big three have selectively adopted this model. A good example is the patient responsibility portion of medical bills. Hospitals and doctors practices have a hard time collecting on these. Fintechs provided a payment portal that made it easier to pay. Two of these vertical specialists were then acquired by Big 3 banks: InstaMed by JPM and AxiaMed by BAC.
Another model is Accounts Payable, where some Fintechs distribute through banks. Fintechs provide an AP dashboard, and monetize by converting ACH payments to virtual cards (VCs) where possible. Their client benefits from VC interchange while getting more efficient payables.
Small Business
In small business, some Fintechs focus on a verticals rather than a specific service. Arguably the ISVs like Toast, Square, Clover, etc. do this is small business. They started processing cards but later extended to payables, disbursements, and other payment services.
Vertical plays in small business are hard to compete with. Most regionals only operate in a defined geography whereas Fintechs and the Big 3 operate nationally. Within a regional’s geography, most verticals don’t generate enough volume to justify investment. In some cases, the regionals partner with a Fintech to leverage their branch distribution with the Fintech’s technology. For example, many banks have partnered with BILL for payables or Fiserv’s Clover for acquiring.
Key Insights
The Big 3 and Fintech-focused banks are gaining TM share. The trend is masked by inorganic growth by Regionals and on-us growth by Consumer Lenders.
The Big 3 are aggregating the large corporate segment at the expense of Wholesale Banks and Regionals
Wholesale-focused banks are losing share as they lack the scale to compete with the Big 3 for large corporate volumes
Consumer Lenders are growing fast, but the bulk of their growth is on-us — bill pay on the Debits side and Zelle volume on the Credit side
Fintech focused banks are capturing volume despite lower scale
The BIN sponsors focus on Neobanks and GPR cards where they have a regulatory moat due to Durbin; but that sector may have peaked
Fintech Specialist regionals show outsized growth; Fifth Third accounts for most of this
The Regionals are growing slower than other segments, despite a boost from inorganic growth. Within Regionals, the larger banks do a bit better. Many of their clients use their TS as a condition of borrowing rather than as an independent choice, but Fintechs solutions are eroding this moat
To outgrow the Big 3, a bank must target high-growth segments like Fintechs. Fintech volumes are growing, but from a small base.
In Large Corporate, where processing scale is key, Fintechs have limited success against the Big 3, except in some cross-border niches where Fintechs have more reach than even the biggest banks
In Middle Market, where lending is key, the Fintechs can peel away specialized use cases either by service or by vertical. The incumbent TS bank keeps the core volume and balances, but lose share of the revenue wallet
In Small Business, where distribution is key, the Fintechs focus on a superior dashboard layer while distributing digitally. That means digital engagement leaves the bank even if the transactions and balances stay put. In some cases, these Fintechs are partnering with banks for distribution