


Are restaurant ISVs near saturation?
Not yet, but close; diversification will be key going forward

Key insights in this post
Restaurants are a key vertical for the ISV model. Most major acquirers focus on restaurants with a software plus payments model
Toast claims 127K restaurant locations out of almost 600K total US locations. Nominal share of locations is therefore only 22% (based on US Census data)
However only 55% of those locations are in-scope:
Big chains (17% of locations) won’t use the ISV model as they can source payments for as little as 1 cent per transaction
Micro restaurants (28% of locations) are too small to justify direct distribution as each one generate only $200 in monthly payments revenue
Eliminating those segments gives Toast ~40% share of the in-scope market
Toast competes with other large, public acquirers with a software+payments model; collectively, those companies have similar share — and all are growing
I conclude that the vertical will become saturated within a few years from a locations perspective
However, growth in ARPU can continue even if US locations growth plateaus:
All major ISVs are globalizing
All major ISVs have entered other verticals with more runway
All major ISVs are cross-selling other services, like lending and payroll
M&A is an opportunity to roll up Tier II ISVs or extend along the value chain
The leaders are all following this playbook
Introduction
Restaurants are a key proving ground for Integrated Software Vendors (ISVs). Most public ISVs focus on it, but niche players are also relevant. Square, Fiserv’s Clover, Lightspeed, and Shift 4 all focus on the vertical and are still growing. ISVs are not just capturing share, but profit – Toast just published 2 consecutive profitable quarters.
These companies are converting restaurants either from older, non-cloud software, or old-style POS terminals – and is some cases from Tier II ISVs. They disproportionately capture new restaurants. Toast claims 127k locations and has added 5-7K locations per quarter for a couple of years now.
At what point are there no unconverted restaurants left? This post will try to answer that question using the US Census Establishments database that quantifies the restaurant industry.
Caveat: Locations are not the only source of revenue growth!
ISVs sell software, payment acceptance, and add-on services. If they run out of new locations, they can still increase ARPU (Average Revenue per Unit) by cross-selling additional software modules and more add-on services. In other words, the end game in locations growth is not the end game for revenue growth.
Diversification is another growth vector:
Go global. All the leading players are globalizing and seem to have traction in many developed markets
Add verticals. All the leaders operate in other verticals, which are not as close to saturation. Toast just extended from restaurants to food-related retailers
Launch new services. Innovative ISVs can add new services to grow revenue. As one example, Toast recently deployed a reservations system that competes with Resi & Open Table among others. Lending is a growth business for all the leaders
The point is that new locations are a convenient metric, but don’t fully predict prospects. Cross-sell consumes less distribution cost, therefore, new services contribute to profits faster than new locations.
So, beware! This is a strategic analysis not a financial forecast.
What does the data tell us?
The Establishments database documents ~600K restaurant locations (“Establishments”) within ~430K restaurant “Firms”. That means, Toast’s 127K locations are only 22% of the vertical. However, that understates Toast share of the attractive opportunity:
Big chains offer much less ARPU per location as they don’t use payments or add-on services (e.g., Loans); big chains account for 17% of locations
Micro-restaurants (<5 employees) have very low revenue per location but high distribution costs; they are not worth pursuing through dedicated sales forces. This segment accounts for 28% of locations
That means 45% of restaurant locations are not as attractive. The other 55% are single location mid-sized restaurants up through small chains. That makes Toast share of the attractive segment ~40%.
Locations and estimated payments revenue by segment
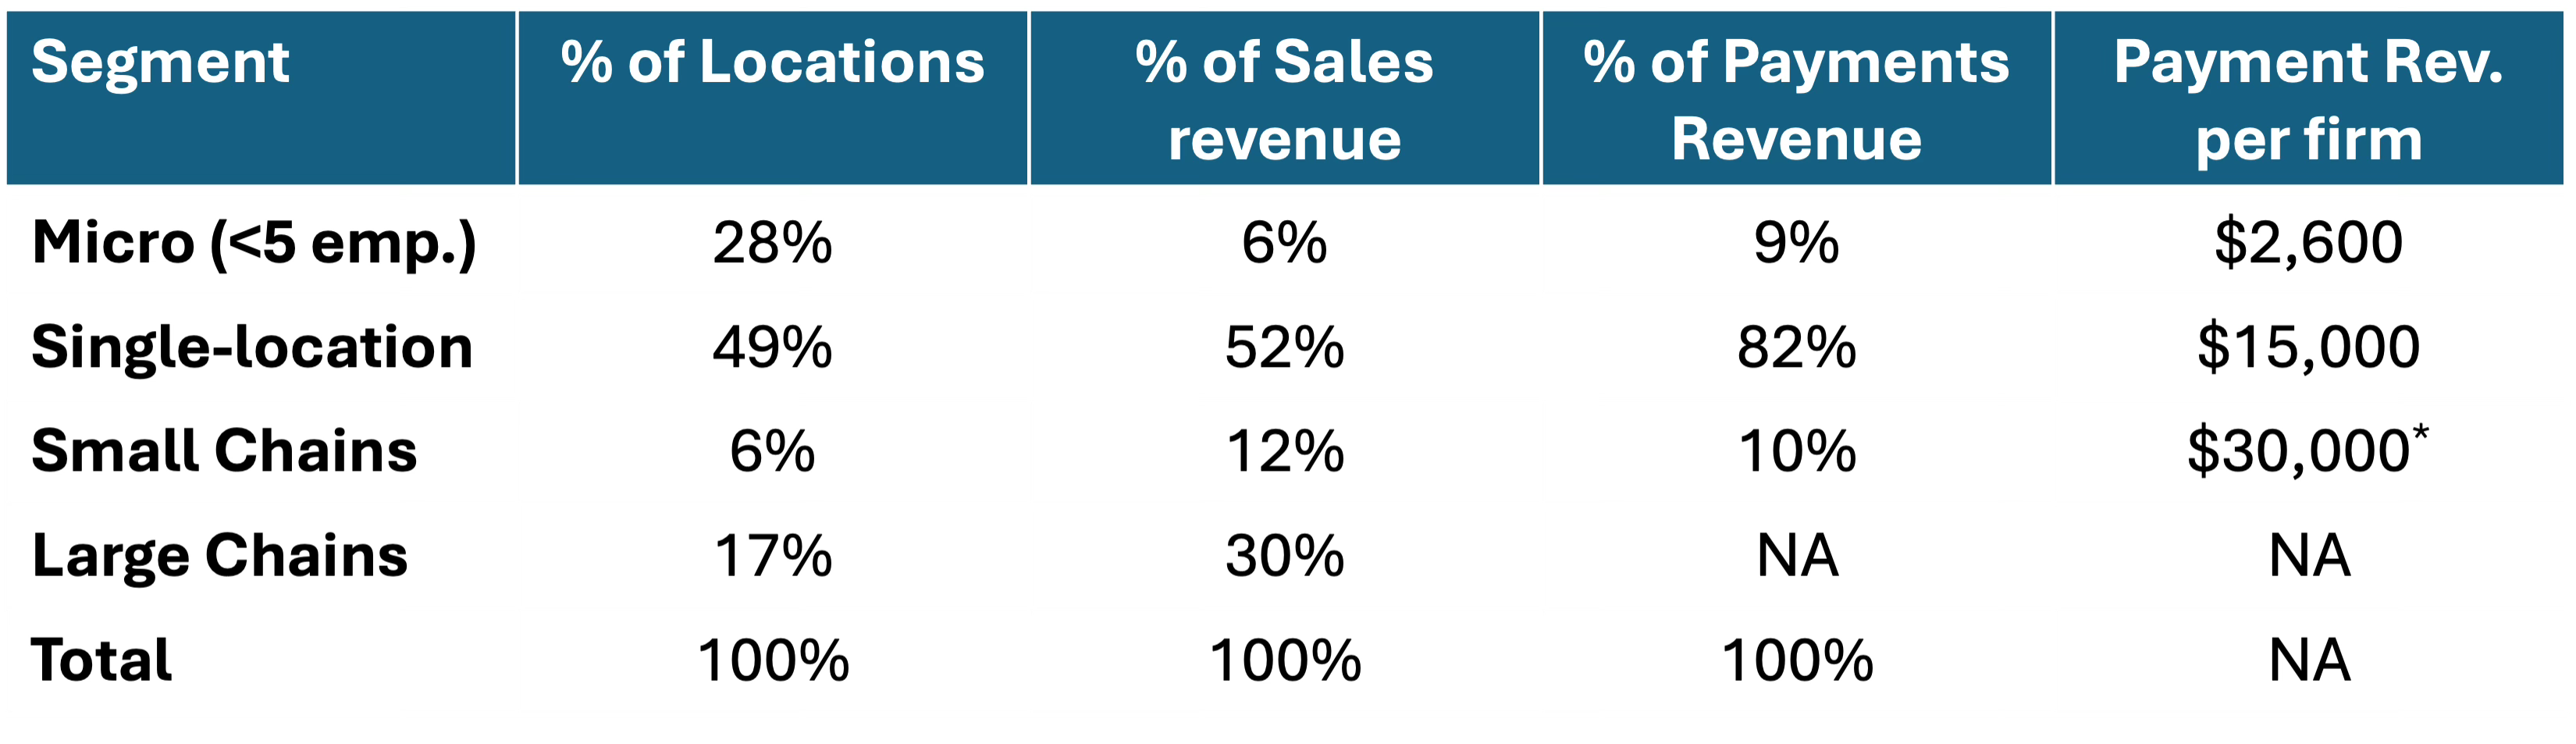
* Note: Payments revenue for Micro & Single-location estimated at 100bp of estimated segment sales. For Small chains I used 50bp.
Even that understates Toast’s likely share by format. The Census data divides restaurants into four format types: Full Service (i.e., Table Service), Limited-service (i.e., Counter Service) and two grab-bag groups which I lump in with Limited Service (both are small).
Total US Restaurant locations
(2021 Census Bureau Establishments database)

While Toast serves counter service restaurants (e.g., my local Ice Cream shop and Bagel Store), its core business is Table-Service restaurants, where it is ubiquitous in my area. If all Toast’s volume was in the attractively-sized, table-service locations they would have 56% share. In Counter Service Toast faces more competition from Clover & Square.
Clover & Square seem common in Counter Service, but less common in table service. All have capabilities to support at least small chains, but are rare in larger chains; Shift 4 does serve larger chains and just bought Revel to serve the single-location segments. Lightspeed is more like Toast.
No other major competitor announces their locations as specifically as Toast does; even if they did, some of those locations are outside the US. In contrast, Toast just started its international expansion so it has few locations that aren’t in our data. Square, Clover, and Lightspeed also serve verticals beyond restaurants, so any locations data they announce could overstate pure restaurant locations. Toast just began to target food-related retailers.
The safest bet is to say that Toast has roughly 40%+ share of restaurants excluding large chains and micros. They overweight in Table Service. The next question is how many locations do the other large ISVs serve, and what is still non-ISV, white space?
Share from other ISVs
The other big ISVs may serve as many restaurants as Toast:
Square. In some advertisements, Square claims its serves 100K restaurants. Their base is 30% Micro (<$125K in annual sales), like food trucks and kiosks, and it may include some restaurants outside the US. Even their next tier up is pretty small at $125-500K and likely skews towards counter service. For lack of better data, let’s assume 50% of their restaurants are in scope (50k)
Clover. “Nearly 200,000 restaurants worldwide trust Clover for their point of sale needs”. That is all the information publicly available on Clover’s restaurant business. But it needs interpretation:
“Worldwide”: At least some are outside the US
“Point-of-sale needs”. I see a lot of Clover Flex terminals being used just like Verifone or Ingenico terminals. These are not tablet-based devices and provide limited software. I would not include Flex-only installations in scope
Clover Connect. It is not clear in Clover disclosures whether GPV include its Clover Connect customers. Connect provides wholesale processing to other ISVs under the Clover brand. This would not be an apples-to-apples comparison for our purposes
For lack of a better number, I assume 50K US locations under the Clover brand with a Tablet-based terminal. They skew counter service. This is an informed guess.
Lightspeed. “~165K locations around the world trust Lightspeed”. Lightspeed is more global than the other ISVs, and likely has the bulk of its locations outside the US. For lack of a better number let’s assume 10K US restaurant locations. They started at smaller restaurants but have pivoted to “complex” restaurants, so their location count has plateaued, as they lose micros but gain larger restaurants
Shift 4. “More than 18,000 restaurant locations use Revel globally”. Again, we have a global location count, but my guess is that about half are in the US. Shift 4 itself had a restaurant base, but most of these seem to have been large chains or stadium venues. Let’s include them at 10K, mostly from the legacy Revel business
Collectively we get 247K locations: 127K Toast + ~50K Square + ~50K Clover + ~10K Lightspeed + ~10K Shift 4/Revel = 247K locations. That would be 75%+ of the target segment; however, that doesn’t include Tier II competitors which are collectively material:
Independent ISVs like Touch Bistro (“15K worldwide”?) & Hunger Rush (~7K – mostly Pizza places), etc.,
Bank affiliated solutions:
Bank of America and Chase distribute NCR Essentials through their branch channels
Talech (~8k locations) is owned by US Bank and distributes through USB branches and through indirect channels
Linga was acquired by PNC Bank, but locations aren’t published
There are many other smaller ISVs in the space. Collectively, Tier II may have 25K US locations in the target segment, or 8% share. That brings the ISV-adopting population to 80%+. Note that these are all marketing claims and likely have a degree of puffery.
Our data is from 2021, at the trough of the pandemic disaster for restaurants; the population is likely bigger today. Of course, new restaurants are more likely to adopt an ISV solution when opening, so I think the 80% estimate is reasaonable.
How much payments revenue is left in the target segment?
We can get a rough estimate of white space payments revenue, because the database provides annual payroll data. Restaurants on average spend 25-30% of their expense base on compensation, so we can back into total expenses per location. Restaurants have margins in the 3-5% range, so we can get from expenses to total revenue. If we assume 100bp of net MDR we can get from Restaurant revenue to ISV payments revenue:
Our target segments have $156B in compensation expenses
If comp is 25-30% of the cost base, then the total cost base is ~$500-600B
Assuming a 3-5% restaurant margin gets us to ~$525-$650B of in-scope sales
Assuming 100bp of payments margin on single location restaurants and 50bp on small chains gets us to ~$4.5B of payments revenue
If ~80% of restaurants already use an ISV solution, US white space is worth ~$0.9B in payments revenue. This doesn’t include software revenue or value-added services — like lending & payroll
All our named ISVs are growing, so white space must be shrinking and location growth will be harder going forward. At some point, the big five incumbents will need to start cannibalizing Tier II, either via sales motions or acquisition (e.g., Shift4/Revel).
Can ISVs go upmarket or down-market?
45% of locations are outside our target segment: either large chains on the upside or micro-restaurants on the low-end. In fact, most of our five companies have some customers in each. In particular, Square has a big business in Micro and Shift4 has one in Enterprise. All our ISVs serve small chains which are in our target segment – these average 6 locations but account for only 6% of total locations. Neither micros nor enterprise are as economically attractive as the target segment.
Micros
28% of restaurants are in the Micro segment, with 1 store and an average of 1.6 employees. These are food trucks, kiosks, snack bars and other small formats. Collectively, this segment has $42B in estimated revenue but only $261K per location. Net MDR per site is a bit more than $200 per month. Overall micros account for only 6% of industry revenue.
So the segment has value, but each store is marginal. To aggregate enough stores to be meaningful an ISV need a self-service model like Square or an Indirect distribution model like Clover:
Square is self-serve at this end of the market. Merchants sign-up digitally and their hardware (if any) is shipped to them. To create that flow, Square needs to advertise and those costs are material. Block does not break out marketing costs for its Seller segment (Square), but overall Block spends $2B per year on advertising
Clover distributes primarily through VARs and bank branches. That keeps direct sales cost down, but instead Clover shares revenue with its channel partners – the bigger the partner, the higher the revenue share. For bank branches, Clover has 2 of the top 6 banks as distribution partners, Wells & PNC. It is public knowledge that those two banks own 60% of their JVs with Fiserv. In other words, while other ISVs might yield 100bp net MDR from an in-scope location, Clover gets 40bp (~$1,000 annually). However, that revenue sharing covers all Clover’s distribution costs. On an outside-in basis, it is not clear whether this indirect model is more or less economic than direct distribution
The other ISVs work through commissioned sales forces, and it just isn’t worth their time to call on micros. In other words, down-market distribution is not the answer to profitable growth.
Large chains
Going upmarket has a similar problem but for a different reason. The ~1,500 large chains capture 30%+ of industry revenue. ISVs need a high-skill sales force to land them, but the size of that sales force can be modest. Some of the very biggest chains have proprietary POS software or they use non-cloud solutions like NCR Aloha or Oracle Micros.
Chains that use ISV software will generate low ARPU per location. Chains will not pay 100bp net MDR for payments or 50bp — more like 1¢ per transaction (IC+ pricing). Further, chains won’t use the other services ISVs provide:
Chains can borrow from banks at lower rates – or issue debt in the capital markets.
Chains get AP/AR services from enterprise-class ERP systems like SAP or Oracle Financials
Chains get payroll from scale providers, like ADP
Chains also expect volume discounts on any services they do use.
Other growth vectors
Since location growth can’t go on forever, the leading ISVs need to focus on other growth vectors – and they are; all are diversifying geographically and by vertical. They are all adding value-added services (VAS).
All of these ISVs offer lending services in the form of Merchant Cash Advance (MCA). These loans are collateralized by the daily card settlements. Repayment happens automatically as a percent of those settlements. This makes MCA a lower risk loan than would otherwise be the case. Many restaurants only use it seasonably to deal with peaks. Other common VAS include payroll, accounts payable, delivery company integrations, and online ordering support.
At this time, M&A seems more focused on adding new VAS rather than buying Tier II competitors. That may reflect the challenge of migrating acquired customers to a common code base. Lightspeed is the poster child for that challenge.
Conclusion
In restaurants, the leaders are gobbling up share in the most desirable segment. White space locations are becoming rarer. The ISVs know this and are pivoting to other sources of growth including geographic and vertical diversification, and new services for each location. At some point M&A will likely become attractive. Distribution scale will play a hand in who wins.
So the answer to our question is: Yes, the restaurant sector is reaching location saturation but location growth is not the only way to sustain revenue growth.