


A new measure of DDA primacy
ACH Receive Credits reveals useful insights about DDA primacy trends

Primary DDA is a key metric for the size and growth of retail banks. Primary DDA is a very profitable product in its own rite, and it is the anchor on which most cross-sell relies — if you don’t have the primary DDA you can’t really be said to have a relationship.
Yet, retail banking lacks reliable metrics for Primary DDA account share. Assets overweight large consumer lenders like Citi & Capital One that have smaller DDA bases. Deposits is publicly available from Call Reports, but it is not granular enough – it intermingles commercial deposits and retail deposits and it mixes savings & MMDA with DDA. Other metrics, like number of branches, underweights remote-only banks like USAA, Navy Federal, Ally and Schwab.
Furthermore, most growth metrics are not merger adjusted. As just two recent examples, when PNC bought BBVA or USB bought MUFG, their nominal deposits grew substantially, but their deposits relative to the pre-merger banks barely budged. In other words, mergers mask organic growth with inorganic growth.
A good good metric exists, but has never been exploited: ACH Receive Credits. NACHA has published a top 50 ACH league table for many years; the publication, usually in March, has two tables: Top 50 Originators and Top 50 Receivers, and each of those tables have a Debits column, a Credits column and a Total Column. The Origination tables are useful for measuring Treasury Services share while the Receive table gives a measure of retail DDA share, particularly the Credits column. The biggest source of ACH receive credits are Direct Deposits, so banks with lots of primary DDAs get more receive credits than banks with fewer. Of course, receiving direct deposits into a DDA is the definition of Primacy.
Methodology
I compared the NACHA data of 2019 to the data for 2023 on a merger-adjusted basis. The adjustment reflects what would have happened if all these mergers happened before 2019. This allows me to track all growth as if it were organic.
Some cautionary notes before we dive into the results.
Direct Deposit is roughly two-thirds of Receive Credits, while “B2B” transactions are most of the remainder. We believe the bulk of these B2B transactions are Zelle settlements, which are another indicator of primacy. Zelle volume growth corresponds to ~75% of B2B volume growth over this time period. The remainder is likely card settlements into merchant accounts, which is an indicator of small business primacy
The NACHA table includes the top 50 only – so the long tail is missing. These 50 reflect about two-thirds of ACH Receive volume. Since 2019, the top 50 have gained ~5% share of credits, accounting for 80% of overall ACH growth – so the head is outgrowing the tail
A handful of small Fis dropped off the list over the 4 years and another handful joined. So the FI list is not strictly apples-to-apples. Given both the leavers and joiners are small, it doesn’t impact the overall insights
The merger adjustments exclude acquisitions of non-top-50 FIs. This happened a few times over this period but should not impact the overall insights, as a non-top-50 FI has relatively modest volume
Consumer asset specialists may get a boost in this approach as some bill pay models push ACH payments from consumers to Issuing banks. These would be received by the lender as an ACH Credit. Major beneficiaries may include the top credit card issuers, especially Citi and Capital One
While Zelle growth reinforces the primacy theme, it could distort the results somewhat. The seven owner banks and early jointers (e.g., USAA, Citi) had more time to build their volumes. In addition, the Big 3 (JPM, BAC, WFC) all had proprietary P2P services before Zelle, which gave them a head start on other members. On the other hand, some of the Big 3 settle on-us transactions without using ACH, so these on-us Zelle volumes understate their relative rank on our metric. Further, a couple of large banks now settle Zelle via the Real Time Payments system rather than ACH, which would also understate their performance on our metric.
Almost all the top 50 are in the Zelle network. Exceptions include four small FIs and the BIN-sponsors, who support the Neobanks. As we will see, BIN-sponsors outgrew other segments despite missing the tailwind from Zelle volume.
Despite these caveats, this methodology improves on Total Assets, Total Deposits or Branches:
Many banks with high total assets or total deposits are small in Retail DDA.
Wholesale banks are top 25 by assets, but not in this Top 50. They include Goldman Sachs, State Street, Morgan Stanley, & Northern Trust. These banks have high assets and wholesale deposits that don’t map to retail primacy
Several of our top 50 banks are overweight in total assets relative to Retail DDA. These include Citi (#4 is assets, #14 on Receive Credits), BONY Mellon (#11 vs. #26) & Schwab (#13 vs. #48). American Express is not even on our list as it has minimal Retail DDA despite high assets
Several Retail Banks have relatively low total assets but significant retail DDA.
Navy Federal is ~#25 by assets, but #8 on our list. It grew credit by 66% over this period
USAA is #29 by assets, but #9 on our list. It grew credits by 85% over this period
The high ranks for USAA & Navy Federal caught me by surprise. Both rank higher than many large branch banks (e.g., TD is #10). This might reflect many low-balance DDAs from the enlisted military population. Such a model generates lots of accounts but modest balances. The two are top 10 in our ranking, despite a remote banking model. Both dwarf any Neobank through the strength of their affinity model.
Performance by business model
So what does this analysis tell us about the market? Here are the results grouped by business model:
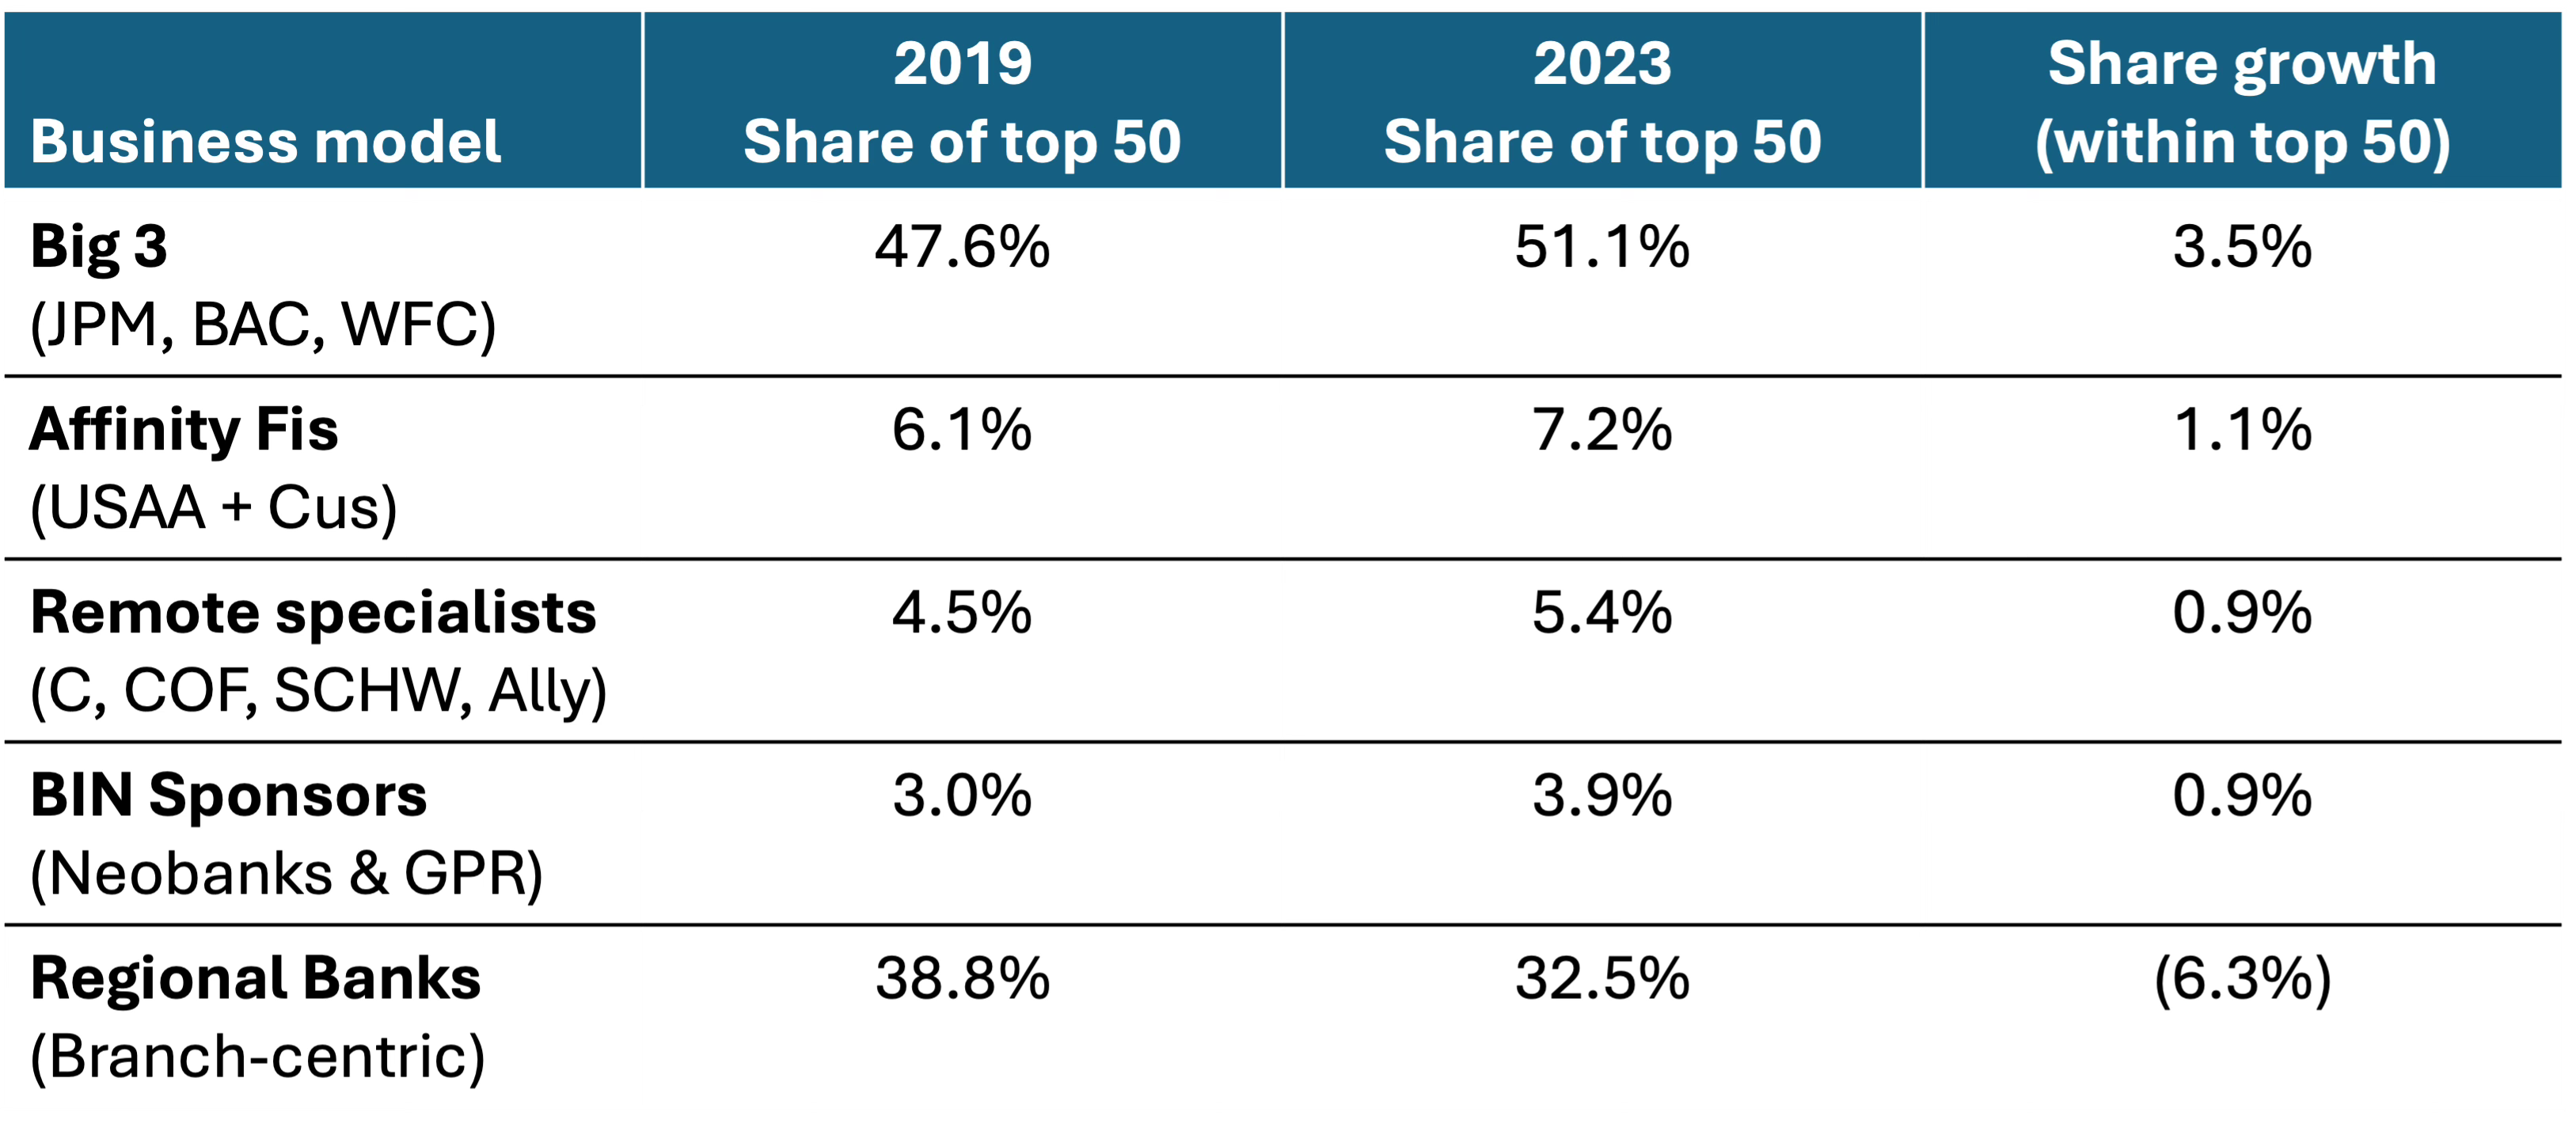
The headline is that regional banks were share donors to all other models, with the Big 3 capturing more than half that. The Silicon Valley Bank crisis and subsequent “flight to quality”, may have helped the Big 3, but that happened very late in 2023 and these trends were similar in 2022 data. Further, the regionals should have been beneficiaries of the growth in small business card settlement as the other 3 models generally don’t serve small business extensively.
The BIN sponsor model may be understated by the shift from GPR to Neobanks. In 2019, BIN Sponsors largely served the General Purpose Reloadable prepaid card industry (GPR) with Bancorp Bank, Pathward (then Metacorp) & GreenDot being the giants of that business. In the pandemic, GPR volumes migrated to Neobanks, so GreenDot fell off our list and Pathward lost ground; in contrast, Bancorp replaced declining GPR volume with new, Chime volume (which it serves with Stride Bank) and grew 90% as a result. Stride Bank (Chime) & Sutton Bank (Cash App) both entered the top 25 by serving Neobanks. The BIN sponsors grew 85% collectively despite Neobanks cannibalizing the incumbents’ GPR volumes.
Note that this represents accounts, not balances. Both GPR Cards and Neobank accounts are low-balance. Today, the total deposits of Stride Bank and Bancorp are ~$10B collectively, not all of which is Chime. Chime earns revenue primarily via “exempt” debit interchange, not deposit spreads.
The Affinity model consists of all credit unions plus USAA. Navy Federal and USAA make up two-thirds of the segment; another 15% represents new entrants from 2019. Many of these large credit unions, and USAA, could just as well be placed in the Remote model, however we thought their Affinity draw was distinguishing.
Within incumbent banks, size appeared to drive growth in most cases;

Except for the third cohort, the pattern is consistent: smaller banks show less primary relationship growth. With all the caveats in mind, this suggests there really is scale in Retail banking. Proof of this has been elusive although we always suspected it. Scale allows more technology spend on digital and national brands have more marketing value.
The key asset of Regional Banks is a geographic focus, which may be fading in importance, i.e., it is less of an affinity then it used to be. Perhaps, Retail DDA is finally becoming a truly national business almost 40 years after the legalization of interstate banking.
So what can the Regionals do to grow? Getting bigger is easy to say and hard to do. Achieving Big 3 size would take generations. Mergers-of-equals are a fast way to size, but not a sure thing. All three of PNC, USB, & TFC closed big mergers during this period, but did not deliver competitive organic growth. Further, regional brands are not promising platforms for national remote banks.
The secret may be in the third cohort, who beat the odds, but it is not clear how they did it. For example, their branch counts are roughly the same at the beginning and end of our analysis period and they are not exclusively in high-growth markets that would provide a tailwind. I will report back if I figure out the secret sauce!
Key insights
Digital and brand appear to be the key drivers of observed growth over this period:
Digital. Branch-lite segments (Remote, Affinity, BIN Sponsor) collectively took ~3% share away from branch-centric regionals. The Big 3 also invested heavily in digital despite a dense, national branch footprint
Brand. All winning models leveraged brand in some way
Remote banks got a brand halo effect from their core businesses
Affinity FIs use lower cost channels from their “common bond”
The Big 3 had national brands and national branch footprints
Neobanks (BIN Sponsors) spent heavily on national marketing.
Within the branch-centric banks, the larger banks outgrew the smaller banks which suggests that scale is factor in both Digital & Brand. Cohort 3 (TD, 5/3, HFC) outperformed other regionals for reasons that are not obvious … yet